
Introduction
This guide is for general practice teams who are seeking to better understand, manage and better align demand and capacity in their practice
General practice faces multiple continued pressures.
Building data collection and data analysis capabilities provides practices with the skills to be able to understand demand and capacity, which in turn supports practices to tackle many different, but often inter-connected challenges for example:
- peak demand on the phone
- running out of appointments during the day
- overwhelming demand on GP appointments
- a rising ‘queue’ of non-urgent appointments
Demand and capacity are a measure of how much work a practice is faced with day to day (demand) and the total resource it has available to deal with that work (capacity)
Measuring and understanding demand and capacity is not a solution in itself, but it does help clearly demonstrate the nature of the current workload in a practice, and the challenges it presents.
Practices who measure demand habitually find that:
- it is fairly predictable, both day to day and seasonally
- it provides facts to validate feelings or opinions about the workload
- having the data enables changes to be tested rapidly, so that effort is put into solutions that are more likely to make a difference
Benefits from understanding demand and capacity
Understanding demand and capacity can provide the data to support decision making within the practice, for example around managing the appointment book, allocating resources and better managing workload across the day, week and year.
Here are some examples of practices who have been able to make improvements following measuring their demand and capacity.
Practice A were finding that they were not being able to meet demand in their practice and, on measuring their unmet demand, were turning away on average 39 patients each day. By collecting their demand and capacity data they were able to identify peaks of demand on a Monday and therefore move routine work, such as care home weekly visits, to later in the week to free up more time for on the day appointments. They also introduced a wider range of options for pre-bookable appointments to reduce failure demand and set up groups of appointments for specific issues which could be dealt with in shorter appointments. This reduced the amount of unmet demand to 9 appointments a day on average.
Practice B wanted to ensure that patients could reliably access care and reduce dissatisfaction. By looking at their demand and capacity data they reconfigured their ratio of urgent to routine appointments and also reconfigured their healthcare assistant and nursing appointments. By looking at conversion rates for telephone appointments they identified a list of conditions that could be booked in straight away to face to face appointments. They also developed reports on their clinical systems to support ongoing measurement of demand and capacity.
Practice C looked at the length of their appointments for their nursing teams. They found that using 10-minute appointments meant appointments were booked for 20 minutes that only needed between 10 and 15 minutes. By reducing the length of appointments to increments of 5 minutes they were able to release a full day of nursing time every month.
Practice D measured their demand on a daily basis and used the data to understand how much capacity they needed on any given day. By doing this they were able to take a more flexible approach to leave requests, moving from a standard number of clinicians allowed off on a given week to an ability to approve leave provided the capacity did not fall below a given amount. This allowed leave to be approved more often than had previously been the case.
What will I learn?
This guide introduces the basic principles of understanding demand and capacity to enable you to make a start with understanding, measuring and acting in your own practice.
It is split into three sections:
- Getting started: if you want to start somewhere, this section gives some suggestions for places you can look at first.
- Modern General Practice: this gives a stepwise approach to redesigning your appointment book and rota to move to a modern general practice model.
- A quality improvement approach to demand and capacity: this section gives a more detailed grounding in understanding your demand and capacity. This section is essential to develop a sustainable approach to measuring and understanding your data to support ongoing improvements to the way you manage your demand.
Demand and capacity are all about understanding our core business in general practice: what the work is that needs doing, what we are actually doing, how we use the resources we have and the implications of those choices.
Modern general practice
A growing population that is also ageing means the demand for services from general practice continue to increase and the complexity of need increases in parallel.
The modern general practice model outlined in the Delivery plan for recovering access to primary care sets out three key elements to support practices to address increasing demand:
- to be able to see and understand all expressed demand, in order to effectively plan how they manage workload and care navigate demand to the appropriate service and clinician
- to reduce avoidable appointments and support safer more equitable allocation of capacity
- to make full use of a multi-professional team and other primary care services (for example community pharmacy) to distribute work appropriately and improve the work environment for general practice staff to support retention
The aim of these is to support practices to achieve a balance between demand and capacity which means no patient who needs a consultation with general practice is turned away and asked to call back tomorrow.
Guidance for practices specifically moving towards a modern general practice model is shown in section 4.
Figure 1: modern general practice model
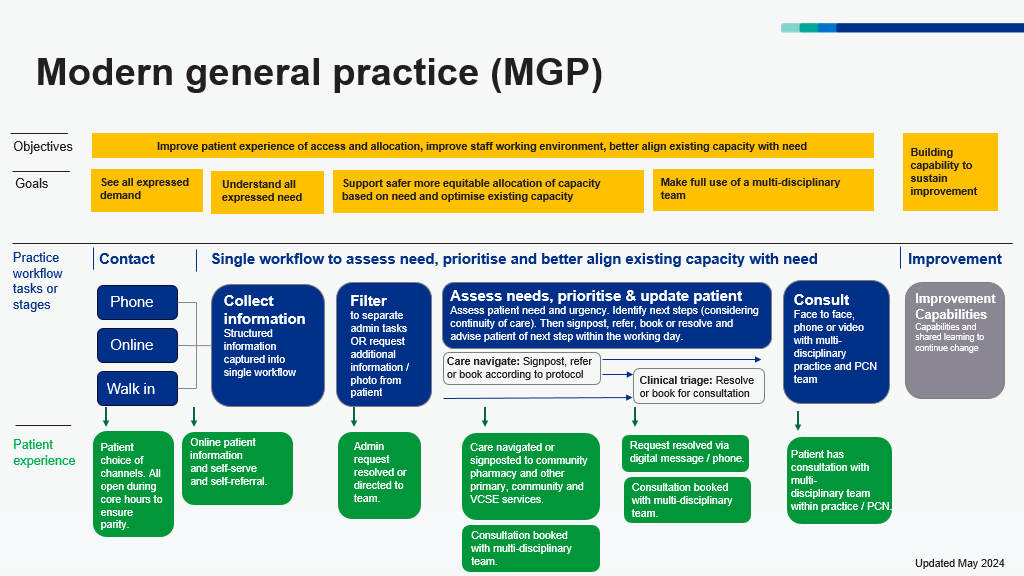
Figure 1 shows that the overall objectives of the modern general practice model are better alignment of capacity with demand, an improved working environment for staff and improved patient experiences. There are 3 access routes to general practice for patients which are telephone, online and walk in. Information is collected at the point of contact to help care navigate patients to the right service at the right time, based upon need and not first come, first served.
A better understanding of patient needs is required to enable more effective and equitable ways of allocating available capacity including increasing continuity of care where needed.
A wider range of roles and services make up that available capacity, and care can be delivered by a wider range of consultation modes.
Collecting structured information at the point of contact (regardless of the access route) enables us to use this information to:
- inform filtering of clinical and administrative queries
- navigate requests to the right service or member of the team
- prioritise requests and allocate to the right appointment type (timeframe, healthcare professional and modality) to meet the need.
These are key steps to a safer, more equitable and more sustainable model of general practice. This guidance will help practices and PCNs implement and optimise these steps.
Much of this will be new to patients and it is vital to improve patient understanding through meaningful communication.
Section 1: definitions, principles and a process
Definitions
Before we start it may be helpful to understand some definitions and distinguish between the various types of workloads or demand you might come across or want to consider.
The Network Contract Directed Enhanced Service categorises different types of workloads as:
- care related encounters which involve the patient and can be any contact type, (e.g., face-to-face, home visit)
- care related activities which do not involve the patient but are about the patient, (e.g., a prescription request, referral, results handling)
- administrative and practice staff activity which are required for managing practice and staff, (e.g., meetings, appraisals, training)
Understanding what practice workload is made up of can help us consider where to start, rather than trying to measure all of it at once.
Demand
This is defined as what patients ask for or ‘all the requests for a service’. Typically, when we think about demand, we are including everything that was provided as well as the services we didn’t have capacity to provide.
Need
Need* is the capacity to benefit from healthcare, and includes sub-definitions of need such as:
- expressed need – capacity to benefit and asking for help
- unexpressed need – capacity to benefit but not asking for help
- expressed unmet need – capacity to benefit but no supply to help. This is what forms the backlog or queue
*The distinction between need and demand is explored more fully in Santana et al – Need, Demand, supply in health care: working definitions, and their implications for defining access. Health Economics Policy and Law (2023) 18, 1-13.
Activity
This is the actual work done.
Capacity
The resource we have to provide a service, or what we could be doing (sometimes referred to as supply).
Queue/backlog
When we have uncompleted work, it builds up to form a queue or backlog. This could be the number of people who requested an appointment but couldn’t be offered one because we have run out – previously we may have asked these patients to call back the following day. Or we could consider the backlog of routine appointments as the number of days wait for a routine appointment multiplied by the appointments offered over that number of days. This is important because it is helping us get a true picture of the total demand for services. If demand exceeds capacity or variation in demand is not met with matching variation in capacity, a backlog will develop.
Failure demand
Some demand may be inadvertently created when we do something that doesn’t add value (seen through the eyes of the patient), such as a patient seeing the wrong clinician and having to come back, patients ringing for results that haven’t been received yet, or contacting the practice via phone because other routes aren’t easily accessible.
Process for managing demand and capacity
Effective management of demand and capacity is an ongoing process and one that may seem daunting initially. This guide will take you through a 3-step process designed to help you structure your thinking and approach so that you can make a start:
- understand variation in demand and capacity by collecting data consistently over time
- smooth variation where possible, to reduce bottlenecks and prevent queues from forming
- match capacity to demand; when we know more about our demand and have smoothed variation, we have a better chance of matching capacity to it
If you work through this process and use the data you collect on the way, you and your team will have a better understanding of the level of need and demand for your service, the size of any potential gap and the steps you may choose to take to accept, address or minimise the problems.
Section 2: getting started
Starting to measure your demand and capacity can feel overwhelming but practices who have started to measure demand and capacity find it gives them back a sense of control.
Examples of how demand and capacity might be addressed
Demand
Smooth demand
- consider timing in the week of routine and follow-up appointments (e.g., avoiding Mondays when acute demand is high)
- consider timing in the year of long-term condition recall against capacity
Reduce demand
- increase use of self-care and self-referral services
- increase use of online services
Reduce failure demand
- ensure care navigation to right appointments with appropriate skills
- work with system partners to reduce transfer of work
- consider failure demand generated by the system, e.g., no time given for telephone consultations
Capacity
Smooth capacity
- timing of annual leave and mandatory training
- sickness and continuity plans
- historic practices e.g., staff start times, home visit patterns, blocking of appointments
- practice culture e.g., fewer people working Fridays
Increase capacity
- recruit additional specific roles
- review appointment book to ensure slot lengths are appropriate to time needed
Better match capacity to demand
- changing shift patterns and capacity to match demand
- adjust capacity of specific roles to match demand
- improve use of care navigation to appropriate healthcare professional
- consider variation across the day as well as seasonal variation
The following are ideas from practices for places to start:
1. Use your telephony data
Cloud based telephony systems can allow you to look at your data across the day and identify peaks in call demand. Understanding this can then allow administrative capacity to be altered through the day, for example reassigning staff from other duties such as document scanning at times of peak demand. This can reduce call waiting times and patient complaints.
2. Look at your Mondays
Mondays are often the busiest day of the week. Reviewing demand data on a Monday can help to decide how much routine work to reassign to other times of the week and help to free up capacity to meet demand. Improving the management of demand at the beginning of the week will often positively impact on days later in the week.
3. Measure your unmet demand
Demand can often feel overwhelming and out of control. Measuring the number of patients directed elsewhere or added on as ‘urgent extras’ on top of the anticipated activity can help give an understanding of the scale of demand that is not being met which can help it feel more manageable.
4. Review your care navigation processes
Carrying out an audit of potentially avoidable appointments can help identify where improvements can be made to the care navigation process to support patients in other ways, both inside and outside of the practice. See companion guidance on Care Navigation available from the national General Practice Improvement Programme resources page.
5. Review your non-clinical activity
Consider when your non-clinical activity is being undertaken such as business meetings and training and consider moving them to days or times when acute demand is lower.
6. Look at your GP appointments data (GPAD)
If it is of sufficient quality, this will give you a level of activity rather than your full demand but can help identify places you want to start with. For example, it can help identify variations in appointment length and allow appointments to be planned to the length of the task. There is a webinar available through Primary Care Improvement Community Connect which can help with understanding your GPAD data. Primary Care Improvement Community Connect can be found via the national General Practice Improvement Programme.
7. Start with your “pain points”
Start by looking at a specific area of demand that is causing most impact on staff or patients. An example of this might be the on-call list or the extras added into the day.
Section 3: modern general practice: redesigning rotas and the appointment book
In this section we outline three steps to redesign your rota and appointment book, and inform care navigation to support as part of a modern general practice model.
- step 1: Collecting demand and capacity data
- step 2: Comparing and interpreting practice data against estimated requirements to inform redesign of the appointment book and rotas
- step 3: Continued iteration based on review of demand data
The following sections cover each of these in turn, you may find it useful to have these tools to hand.
- demand and capacity data collection spreadsheet which is available as a spreadsheet to download from the national General Practice Improvement Programme resources page
- demand and capacity estimation calculator which is available as a spreadsheet to download from the national General Practice Improvement Programme resources page
- avoidable appointments collection spreadsheet which is available as a spreadsheet to download from the national General Practice Improvement Programme resources page
- tally chart to record the queue (see appendix below)
- process mapping guidance
Step 1: collecting demand and capacity data
Overview of demand and capacity data collection to support modern general practice
Appointment
- adjusts issues providing timely access to care
- repeated patient no-shows are tracked and managed
Demand
- on occasions, demand can exceed supply (e.g., lengthy wait times or queues)
Need
- volume of demand and capacity can be completely mismatched
- proceed with caution when scheduling appointments for another service
If practices have data on contact, demand and capacity they can:
- adjust roto to provide increase call handling capacity at peak time
- move contact demand to online
- see, understand and better meet expressed demand
- navigate patients from practice to other appropriate services
- navigate patients to appropriate healthcare professional (reducing GP demand)
- navigate patients to appropriate modality
- to adjust rota capacity and mix
- change overall shifts / capacity of specific roles
- recruit additional specific roles
To collect data about demand and capacity we need to understand the volume of appointment requests (telephone and online consultation requests) distributed by time of day/day of week alongside variation in capacity usage.
This will enable us to:
- understand the ‘shape’ of our demand
- better match capacity to peaks in demand e.g. for answering calls, spread routine demand throughout the week to ‘less’ busy days, optimise timing of clinics
- reduce the ‘queue’ i.e. volume of expressed unmet demand and factor this into how to plan and use capacity
Understanding data on the nature of clinical service need will enable us to:
- understand what type of patient need goes where (to other services, type of healthcare professional) to improve care navigation, reduce avoidable appointments and avoid duplication of work for patients and staff
- understand the volume of that need to inform capacity and skill mix requirements and to inform how to distribute available capacity
- understand how much demand is same day demand versus routine demand (and understand variation by day of the week). This supports planning our appointment book and avoids clinicians needing to squeeze in ‘urgent extras’, instead distributing work more evenly across the week
- encourage consistency in ways of working and reduce unwarranted variation and duplication of work within the team
Mapping our current appointment allocation process using this Conventional process mapping guidance will enable us to understand how we are allocating capacity and identify bottle necks, constraints, problems and opportunities
To map our current capacity allocation and to optimise this process we need to undertake four data collection activities:
- demand patterns; access and review demand patterns using data from telephony and online consultation systems
- capacity use: review variation in capacity use from the appointment book
- audit of clinical need and avoidable appointments
- auditing the queue (unmet need)
Data collection and analysis activity 1: Demand patterns
Start by accessing data from your telephony and online consultation providers, as a minimum access and look at:
- volume and distribution of telephone calls
- volume and distribution of online consultation requests
If available, also access and look at:
- variation in telephone call wait times (time of day/day of week)
- volume and distribution of dropped telephone calls (time of day/day of week)
- call length times
For more information on accessing telephony data please see companion guidance Improving Telephone Journeys available from national General Practice Improvement Programme resources page.
Data collection activity 2: Capacity use
Building on the first activity, you next need to look at your capacity usage.
Capacity needs to closely mirror demand. If average capacity meets average demand but there are peaks and troughs in the capacity, bottle necks will arise.
This data collection activity aims to build a picture of how capacity is being used and to look for opportunities to smooth and optimise use of capacity. This is described further in a later section called “Smoothing Variation”
Analyse filled and unfilled appointment slots by healthcare professional/session/day of week in your appointment book. Some GPIT systems offer a workload tool to help you do this.
We want to understand where practice processes can be improved to optimise use of capacity. A good example of this is by understanding how sessions are made up and where there might be opportunities to improve the design.
- are there appointments being routinely blocked out? How many are routinely blocked out and why does this occur?
- are all appointments being fully utilised? If not are there any trends or patterns? For example, are there ‘on the day’ bookable appointments available at the start for the day which are not filled due to the time taken for calls to be taken when the phone lines open? Are there slots that have been set aside for specific purposes that do not match the demand for this?
- is the appointment book inadvertently working against you? Do appointment slots and timings reflect reality?
Data collection activity 3: Audit of clinical need and avoidable appointments
This activity aims to build a picture of all the consultations offered at the practice in a given time period and understand:
- the type of clinical need
- the level of urgency of the need
- the consultation modality needed
- how many consultations required a general practice service and how many were undertaken by the appropriate healthcare professional. Therefore, identifying how many could have been managed differently and were potentially avoidable e.g. self-serve, self-referral, navigation to a different service or healthcare provider
Clinicians can complete this audit at the point of consultation.
Practices can use the Avoidable Appointments Data Collection spreadsheet to record this information (the spreadsheet is available to download via the national
Collecting and analysing this vital information can be time consuming when done manually and many practices therefore start by collecting a sample of one week’s activity.
The important thing is that the data has to be good enough to make decisions (useful) rather than needing to be perfect. Be sure to explain the reason for doing it, and to share results with the whole team afterwards.
| Clinical needs audit Aims to understand the volume and mix of consultations delivered | Potentially avoidable appointments audit Aims to understand which member of the multi-disciplinary team both within and outside the practice is most appropriate to meet the presenting need |
|
OR should it have been managed by a different named clinician? For example, there was a continuity need that was unmet, a preference for a female clinician or a clinician with a specialist skill set. |
Data collection activity 4: Audit of queue (unmet demand)
‘The queue’ is a record of patients who approached the practice and who needed an appointment with general practice but that need couldn’t be met today and they were asked to call back another day or asked to use another care setting.
Count the number of patients who approached the practice whose need couldn’t be met today over a one or two week period.
This can be collected in two simple ways:
- by reception teams keeping a paper ‘tally chart’ at the point of contact (see appendix)
- by creating an ‘inactive clinic’ in the appointment book and recording patients turned away in this ‘inactive clinic’
Step 2: Comparing and interpreting practice audit data against estimated requirements (to inform redesign of the appointment book and rotas)
For this you will need the Digital triage demand calculator. This is available to download via the national .
In this step we are entering the data collected into the demand calculator to estimate the number of sessions and type of health care professionals required to meet the need expressed to your practice.
You can then compare the current appointment book and rota design with the estimated need.
You should consider the following in the redesign of your appointment book.
- number of estimated clinical sessions needed by day of week
- the spread of same day vs routine need by day of week
- the spread of clinical sessions by type of HCP
- number of potentially avoidable appointments with improved care navigation processes
- quantify the gap between need and capacity to inform recruitment, skills development, PCN level or wider integrated services
Using the digital triage demand calculator
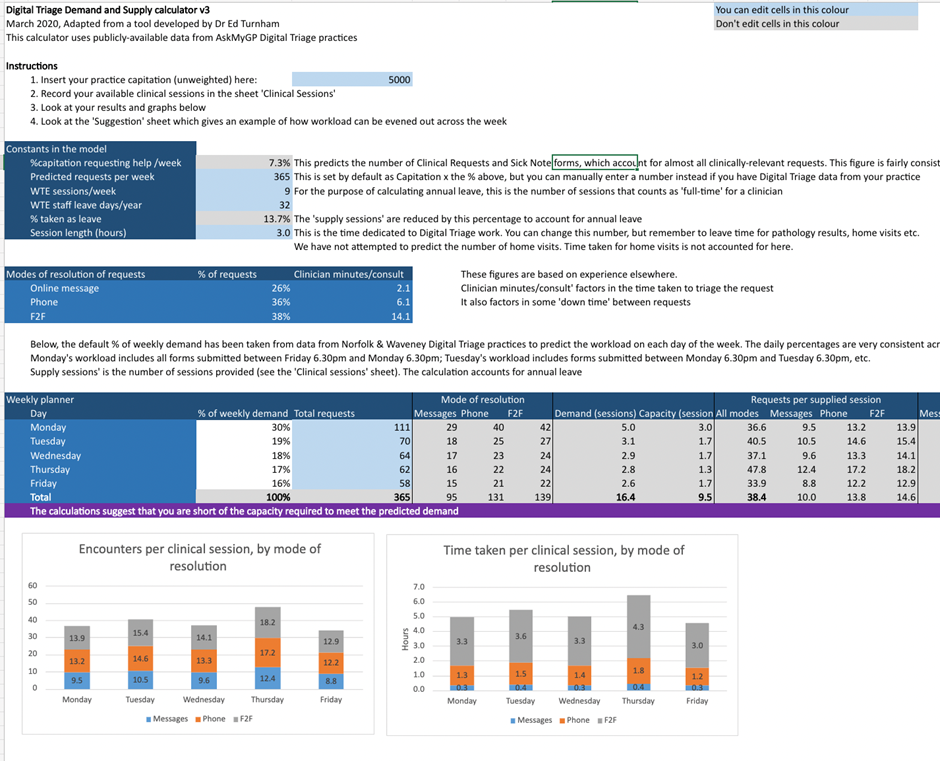
Figure 2: The Digital triage demand and supply calculator dashboard
In addition to staff capacity to provide the appointments that are needed, consider physical resource such as rooms, phone lines, computers as this can place a limit on the actual capacity we can supply.
A structured appointment book gives clarity but should also offer flexibility in response to the demands of the day, offering contact types to meet individual patient circumstances and needs. Carving out inflexible times for each appointment type risks wasting valuable capacity and contributes to clinician stress (London General Practice Access Guide and Manual – Transformation Partners in Health and Care).
Once you’ve agreed the design of your appointment book with the whole team, you will need to align your clinical and non-clinical rotas.
Tips when setting up your appointment book:
- turn off automatic SMS reminders to patients for triage slots
- align appointment book slots with associated GPAD categories
Variation
Understanding variation in our demand patterns and capacity provision and usage of that capacity is important as it helps us to determine what we need to plan for, how we distribute our workload and when we need to change the system to get better results.
Capacity tends to be in our control and variation can be as a result of the system we have in place. Some types of demand are in our control and where this is the case we can manage or smooth the variation. Sometimes this is due to failure demand, for example:
- escalating expressed needs because of delays in treatment pathway or increasing anxiety.
- patients with complex needs who require continuity being seen by a locum clinician.
- not allocating the right healthcare professional, service or consultation modality first time
Further information on this can be found in the ‘Failure Demand’ section in this guide.
Variation in clinical practice
Some variation also happens in clinical practice. Some of this can be considered warranted in terms of the autonomy of practitioners and diversity of patients. But some is unwarranted and conversations may be needed sometimes to standardise our approaches and processes, based on evidence-based practice, which can smooth variation.
When designing your appointment book and rotas consider the points in the smoothing variation section (Section 2).
Step 3: Improve and re-test
Plan-do-study-act (PDSA) cycles
It is important to embed a Quality Improvement approach to continue and sustain the changes made.
When we measure over time, we can see the effect of any changes we make. The Model for Improvement and PDSA cycles support us to do this.
Improving alignment of your demand and capacity is an important step in reducing pressure on the team and improving care for patients. It is not a substitute for recruitment and retention of GPs and other staff.
By understanding the gap, practices can use this information to support discussions with their commissioner and LMCs alongside exploring how certain services or pathways could be delivered differently for example at PCN, neighbourhood or wider aligned with the vision outlined in Next steps for integrating primary care: Fuller stocktake report.
Section 4: a quality improvement approach to demand and capacity
Measuring demand and capacity
When to measure?
‘When’ may be approached from different perspectives – over what time period, and when in the process?
Improvement measurement is a collection of data over time. When it comes to an appropriate time period for demand and capacity, continuous measurement is the the ideal.
When we measure over time, we can see the effect of any changes we make, whether that is improvement, getting worse or staying the same. The better the data we have, the more informed we will be to make good decisions.
Pragmatically though in the real world this is not always possible – or even sometimes necessary. Sometimes we must sample specific elements of demand or capacity at different times, depending on the problem we are addressing.
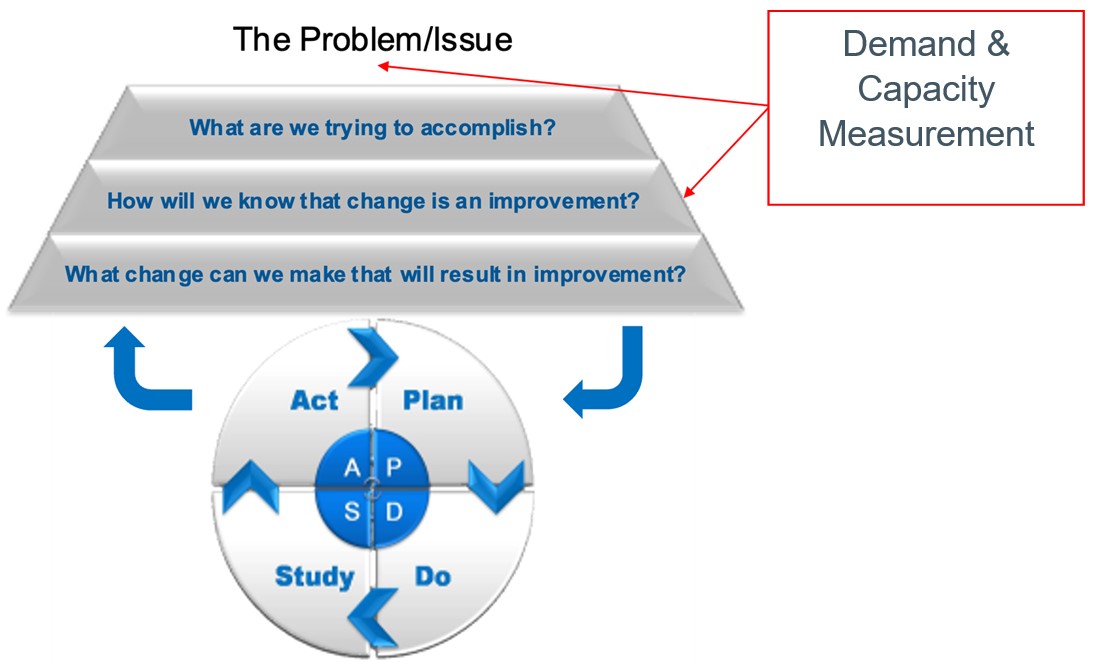
Figure 3: The Model for Improvement
What to measure?
Your choice of measures will depend on the problem that is being addressed.
While your initial focus may be on appointment demand, the same approach can be applied to all forms of demand including telephone demand and non-patient facing workload, such as document workflow, pathology results, prescribing and more.
Total demand or need for appointments is made up of three elements:
- Activity – count of ‘work done’
- Unmet demand – backlog/queue
- Unknown demand (what we don’t know)
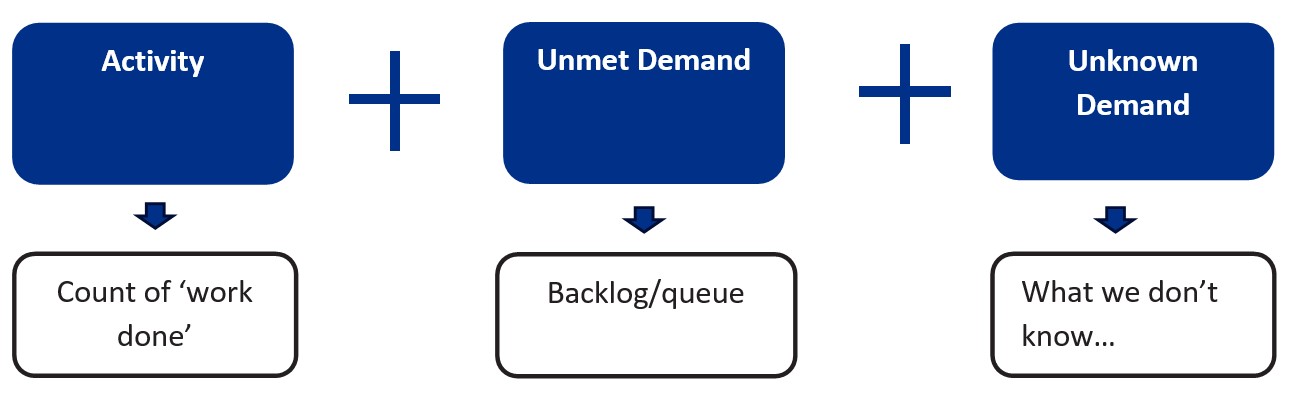
Measuring activity along with unmet demand will give a reasonable sense of the current total demand for appointments. We will look at these in more detail below.
There will also be elements of demand that it will be more challenging to capture but may be worth the effort, depending on your access to data or the problem you are looking to address.
Unknown demand
Unknown demand is particularly hard to capture as it is principally a result of unexpressed need. If need is not expressed, it is more difficult to identify or plan for it. Sometimes need is not expressed or identified due to unintentional barriers in our own or the wider system – consider what we know about health inequalities or lack of suitable access pathways for certain groups.
We can use population health data as an indicator for unknown demand or look at those groups in our own population who we are not seeing but might otherwise have expected to. This is a difficult element to capture however, so it is worth remembering to seek useful rather than perfect data.
One indicator of unknown demand can be obtained from practice telephony data. This allows you to identify the level of abandoned calls (callers who hang up) or dropped calls (where the system causes a call to drop). This data is useful as an indicator that access to speak to a member of the team is improving. Shorter waiting times and fewer abandoned calls may be a result of people getting through on the phone more quickly, or fewer people calling – but it isn’t a measure of demand in itself.
The companion guidance Improving Telephony Journeys has been developed to help you understand and improve your telephone access and is available via the national General Practice Improvement Programme resources page.
Measuring activity
Activity, or a count of work done, will account for the biggest proportion of the total demand figure in most cases and is easier to capture. The most likely source of activity data will be from practice systems or appointment books: what did we actually do?
The starting point is to understand how many appointments were undertaken on any given day. We can choose to break this down in different ways depending on the problem we want to understand.
- a very basic level, counting the total number of appointments undertaken will give you a high-level understanding of activity. However, if the issue is that the practice appears to be struggling for GP appointments you will want to break the data down to differentiate roles
- it may be that a significant challenge is very long urgent on the day/duty doctor lists so you want to understand what proportion of the activity relates to this appointment type
- furthermore, you may want to understand how many urgent on the day appointments have been added or squeezed into the appointment book. This is important to count as it represents activity that is additional to the set capacity that was planned and is therefore a potential source of additional pressure experienced by staff and clinicians
Example categories for measuring activity
Role
- general practitioner
- nurse
- health care assistant
- advanced nurse practitioner
- specialist practitioner
- clinical pharmacist
- first contact physiotherapist
- mental health nurse
Modality
- face to face
- telephone
- online consultation
- virtual
Type
Reactive demand:
- urgent on the day
- routine
- prebooked
Planned care:
- Long term condition reviews
Problem type:
- musculoskeletal
- dermatology
- mental health
Activity data can be extracted from your appointment system – some allow you to download daily activity data, where others may require you to manually count in order to extract the data and while this has a cost in terms of time it is an accurate measure of activity. Software solutions exist to extract this data but can be cost prohibitive.
In some practices once all the appointments are filled any additional requests from patients will be squeezed in as ‘urgent extras’ on the day. These patients should be counted as activity (work done) but it can also be helpful to identify them as a separate category to demonstrate exactly what was needed above the planned capacity.
A simple way of pulling this data together will be to use the Demand and Capacity Data Collection Spreadsheet available on the national . This can tabulate the different categories that reflect the way your practice organises its appointments.
Measuring unmet demand
In order to measure the total demand, we need to add the count of activity (the work done) to the count of unmet demand.
Unmet demand is where a patient asks for an appointment or service, but there are no appointments left to meet their need. It is important to collect this number in order to understand the deficit between the number of requests for an appointment and the planned capacity, which in turn helps us quantify the gap between our demand and our capacity and identify options.
For some practices unmet demand will be the number of patients asked to call back another day and is best counted with a manual tally at reception. Be wary of asking staff to undertake this exercise too often, be sure to explain the reason for doing it, and to share results afterwards. These types of manual data collection are a call on the goodwill of already stretched staff and need to be handled with sensitivity.
With recent changes to the GP contract and the requirement not to ask patients to call back once all the appointments are gone, it is possible that all the requests are recorded in some way and therefore it is likely that true demand is captured as data. In this case it is still important to differentiate between the demand that is met, and what was required to meet additional demand once all the capacity in the practice was utilised.
Measuring capacity: what to count
Alongside demand goes capacity: the resources we have available. Demand as already stated is mostly predictable – but also predominantly outside our control. Capacity, however, is based around our system design so is within our control to manage. Measuring capacity, and how we are using it, is therefore just as important if want to ensure that we are utilising resources to their optimal potential, and to help us identify where and how big a gap there may be between what we have and what we need.
Capacity is all the resources required to provide a service. This naturally includes appointments and their types. It also includes physical resource such as rooms, phone lines, computers and importantly, staff. It is one thing for example to have enough staff to provide all the appointments that are needed, but if we don’t have enough rooms then this places a limit on the actual capacity we can supply. Measure all the relevant aspects of capacity when considering the key area of appointment capacity.
How and what we count with regard to our capacity will, as with demand, be centred around the problem or issue that we are dealing with and may therefore be undertaken at different levels of detail.
Measuring capacity: appointment capacity
Although it is probably the easiest way to consider capacity, counting staff sessions will not give enough granularity to understand how capacity is being used: just because a member of staff is on duty doesn’t mean they are available to provide appointments. Therefore, as with activity, it is best to measure appointment capacity based on the actual number of appointments available. The level of detail should ideally mirror the activity you have chosen to count (see Figure 6) in order to allow comparison of capacity versus activity. We want to understand the total number of appointment capacity that is set at the start of each day, some of which may include slots that are already populated from prebooked appointments. This information can be collected using the Demand and Capacity Data Collection Spreadsheet available on the national General Practice Improvement Programme resources page.
Measuring capacity usage
Sometimes when we analyse planned capacity and its usage it can throw up surprises. It may appear for example that the appointment capacity we have in theory – based on staff numbers and roles – is not what is available in practice. Such instances need to be handled carefully, and with the active engagement of staff, to understand what is really happening and why, and where there is scope to improve things. What we want to avoid is any sense of individual blame or judgement, which can arise if the analysis of capacity usage is not handled appropriately.
A good place to start is by understanding how sessions are made up and where there might be opportunities to improve the design and free up potential capacity. For example:
- are any appointments being routinely blocked out for non-clinical activity– how many and why does this occur?
- are all appointments being fully utilised? If not are there any trends or patterns? For example, are there on the day bookable appointments available at the start for the day which are not filled due to the time taken for calls to be taken when the phone lines open? Are there slots that have been set aside for specific purposes that do not match the demand for this?
- is the appointment book inadvertently working against you? Do appointment slots and timings reflect reality?
Measuring absences is another way of understanding our use of capacity. Planned absences such as study leave, training or holiday can be identified by month, week or day over an annual period. Because these are all planned, they are within our control and become increasingly relevant when considering sections below on variation and matching demand and capacity. Unplanned absence like sickness are inherently less predictable but still valuable to measure. We may well identify seasonal patterns that can factor into our capacity planning.
Step 1: understanding variation
What is variation?
Once we have started to collect our data around demand and capacity, we need to consider variation. There will always be variation in systems and processes – if you think about a journey to work it will vary from day to day, but you will have a good idea of how long you can reasonably expect your journey to take most of the time. This is known as common cause variation – a level of variation we expect to see that is normal within the system we have designed and that we can predict over time. Sometimes a specific event – a flat tyre, a major hold up, empty roads on the first day of school summer holidays – will significantly alter the time to be more or less than you would normally expect, to a noticeable degree. This is indicative of special cause variation – something we wouldn’t expect to see routinely and that we can assign a cause to.
Why does variation matter?
Understanding variation is important as it determines what we need to plan for, what can be managed and when we need to change the system to get better results. For example, when you think about your journey to work, if you want to ensure you are always on time, you need to understand how much variation to take account of and plan accordingly. If you only plan for the average, you are as likely to be late as to be early – so you will probably plan for what you know is the maximum time it is likely to take. The same principle applies to our daily workload and capacity – how much does it vary, what do we need to plan for, how much of a gap between demand and capacity do we routinely have that we can accept, or that we want to fill? As we have already noted, what we generally find when we measure demand and capacity over time is that it proves to be surprisingly predictable, meaning that we can both see and quantify the problem and make plans to close the gap.
The other reason this is important is because the greater the variation in daily demand and capacity, the harder it is to plan our service effectively and manage it efficiently. . While it may not be possible to offer a level of capacity that completely eliminates any queue or waiting time, understanding and managing variation will allow you to start to plan for, and manage, that disruption, giving back some sense of control.
Using run charts to understand our data
In order to understand variation in our demand and capacity we need to display the data in a way that makes visible what is happening over time. Only using averages won’t show us the range of variation that is common day to day and that we need to consider when planning.
The easiest way to do this is to use a run chart – a simple graph you can create on Excel that quickly shows you the patterns in your data, with minimal complexity.
Once you have captured your data, adding the median (the middle value of the numbers in your data set) as the centreline on the run chart allows you to see the point around which the data is expected to be spread evenly. We have said that demand and capacity are surprisingly predictable, and this becomes apparent when we display the data in this way:
Figure 5: Example run chart showing daily demand
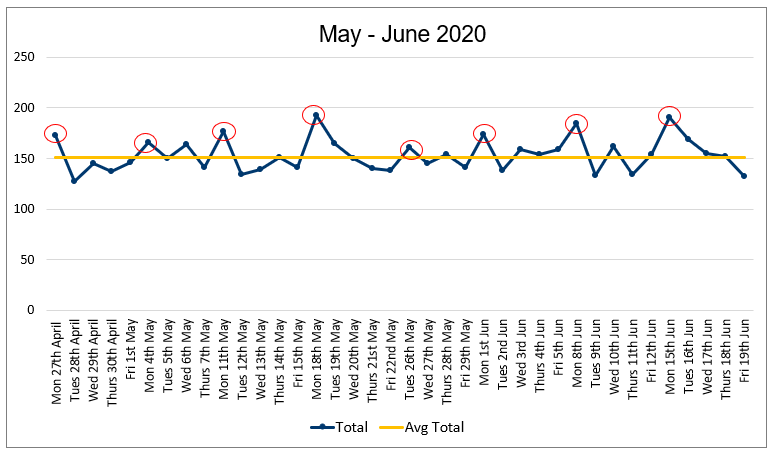
You can find instructions on how to create a run chart on the AQUA website. The Demand and Capacity Data Collection Spreadsheet is available on the national General Practice Improvement Programme resources page.
Note: run charts are sufficient for displaying and understanding your demand and capacity data, and determining the impact of changes, but if you are interested in deeper analysis you may like to look at the Statistical Process Control guide on AQUA website.
Once you have created your run chart you can begin to determine what it is telling you about the variation in your system at present. Some of this will be immediately apparent from first glance – look for specific patterns or anomalies that stand out.
- are there any unusual patterns across the day/week/year?
- do specific times stand out as different from others?
- are there any particularly high or low points?
- what do we know about those patterns?
You can also apply specific probability-based rules to help you interpret and understand what is happening, particularly when you have made or spot a change in the pattern of data, and to avoid over or under reacting to specific instances or apparent patterns.
One thing to avoid is adding what Excel calls a “trend line” as this is not the same as a statistically significant trend – it is just finding a line that best fits the data points displayed and can therefore be very misleading.
Step 2: smoothing variation
When we think about demand and capacity, we tend to see it as a single ‘entity’ to be managed. But when we are smoothing variation, we want to think of them separately.
Capacity tends to be in our control and variation can be a result of the system we have in place. This becomes visible when we plot the dots on a run chart. For example:
- annual leave and mandatory training – we expect capacity to vary in response to staff leave and training, but where is the majority of this type of leave granted across the year? Do we tend to see an increase in the last quarter of the year where we also see the highest demand? Ask yourself how much of this variation is helpful (some will be) and consider where it is creating a greater mismatch with demand and contributing to a possible queue
- staff absence and sickness causes variation in our capacity that feels outside of our control – it is inevitable that staff will become unwell at times, and right that they should be supported to recover by taking time away from work. But this type of demand should be expected and if we don’t have continuity plans in place for when it happens it will contribute to greater variation in capacity. For example, work within your PCN for a shared response with patients being seen in another setting for a risk-sharing approach, have a list of regular locums who may be able to do sessions at short notice or if administrative staff have a flexible team to cover various roles
- historic practices such as staff start times, home visit patterns, and blocking appointments for other activities
- practice culture for example how individuals manage capacity e.g. blocking appointments
Some types of demand are in our control and where this is the case, we can manage the variation. For example:
- do we have too many routine appointments and follow-up appointments on days when our requests for urgent appointments are greatest?
- when in the week do we hold our clinics and are they at times when patients are most likely to benefit?
- how practices manage long term condition appointments. Does the practice do a lot of work at the end of the financial year when capacity is lowest?
- do we need more phone lines / receptionists answering phones at certain times of day?
- are we capturing information about patient need at the point of contact consistently to understand the type of appointment needed and where we have them? Or understand the right consultation type needed? Can you offer longer appointments when needed for patients with long term conditions that over the year will reduce the number of times they visit?
- have you agreed how different types of demand and patient circumstances are managed within the team e.g. vulnerable patients, continuity needs, patients who frequently present
- does the team have a consistent approach to, e.g. prescribing, navigation/signposting, referrals? Are we supporting navigation with digital telephony routing and online consultation tools functionality?
These types of variation are what we tend to consider unwarranted in that they are not beneficial to the patient and therefore can be reduced or ‘smoothed’. Similarly, a degree of variation also happens in clinical practice, some of which can be considered warranted in terms of the autonomy of practitioners and diversity of patients. But some is unwarranted and while courageous conversations may be needed to achieve it, sometimes standardising approaches and processes based on evidence-based practice can help to smooth variation.
Ideas for smoothing variation from practices
There isn’t one solution for reducing the variation in either capacity or demand, but understanding where variation exists in our practice can give us ideas to test using the Model for Improvement and PDSA cycles. The following are ideas from practices around the country:
- minimise the use of ‘follow-up’ appointments on Mondays
- test increasing capacity on a Monday by having an additional duty doctor – does this reduce our queue on subsequent days?
- use ‘urgent appointment hub’ appointments that are under-utilised on other days
- change the day of care home MDTs to a Wednesday
- consider rules for how many doctors can be off at the same time
- match receptionist/care navigator rotas to peak contact times
- communicate to patients about their points of access so they use the most appropriate contact method for their needs
- actively promote and enable digital solutions, ensure your website is up to date with prominent links to self-service and self-referral
- support navigation with digital telephony automatic routing e.g. administrative queries directed straight to back-office staff, and promotion of online consultation tools to directly gather information from patients to reduce pressure on reception teams answering calls
Step 3: matching capacity to demand
When we have understood our variation and smoothed variation where we can, the next step is to match capacity to known demand. This can’t be done without the preceding steps: you need to know what the pattern of demand is across the week. If you only have two weeks’ worth of data you can make a start, but you will need more to reach reliable understanding and solutions.
Matching capacity to demand starts with resetting the appointment system, and we may need to think about this in different ways.
- match by time of day: For example, some older patients or those with long term conditions will struggle to make 9am appointments: can you make appropriate appointments available later for people who can’t get in early? Do you need more phone lines/receptionists answering phones at certain times of day?
- match by seasonal variation: knowing what you have coming at different times of year. For example, changes in demand or capacity around holiday seasons enables you to plan routine demand accordingly and the right capacity to meet it.
- understand the types of appointment needed and when and where you can provide them. Do you have the right skill set in practice and how does this inform recruitment?
- right consultation type: can you offer longer appointments for patients with long term or multiple conditions that over the year will reduce the number of times they visit?
- care navigation: have you got consistent and effective processes in place, and the right options to direct to? Can you quantify the need for additional or alternative services to support you? Is there scope and evidence for a PCN solution?
- can you apply the same principles to your telephone system?
So, what happens when we do all this and still don’t have enough capacity to support demand? Considering which patient appointments are appropriate for the clinicians they are booked with, and which could have been avoided, is one place to start. The a
The companion guidance Improving Care Navigation can help you with this and is available via the national General Practice Improvement Programme resources page.
Another is to consider where some of the demands on our time and appointments arise because of process failures – we call this failure demand and we can reduce it.
Section 5: reducing failure demand
Once you have got a grip on understanding, smoothing and matching your demand and capacity you may want to look at possible failure demand in your system.
It is a signal of something not being effective in the system. For example, when something isn’t completed effectively the first time it has to be repeated, which will result in additional calls (to as well as from the patient), additional appointments, and ultimately complaints, which in themselves create demands on time and energy.
Patients are the ones who primarily experience failure in the process, and failure demand is best described through their eyes. But practices also experience the cost of failure in the process: the cost is usually to capacity, because of work being repeated or being completed less efficiently than is possible.
The good news is that failure demand can be reduced, thus reducing that cost to our capacity.
Finding failure demand
There are a number of areas we can look to find, and then reduce, failure demand.
1. System interfaces
Any part of patient care that relies upon another service is at risk of failure demand. This can be observed in the interface between practices and other parts of the health and care system but can also be seen within the different parts of a practice – in fact, anywhere that requires handoffs between individuals. Within general practice this may be the route into appointment types (telephone vs face to face) resulting in the patient having to attend multiple appointments where one could suffice, or when patients are booked with the wrong individual, or are booked in too early following tests when the results aren’t yet available.
2. Incorrect use of specialist practitioners
The more specialist our appointments become the more open we become to using them incorrectly. This can happen in many ways in the practice across all specialties:
- booking a GP appointment for specialist interventions such as joint injections, coil fit, or menopause consultations with the wrong practitioner will necessitate rebooking, and the waste of an appointment slot
- multi-step diabetes pathways requiring specialist blood tests before appropriate nursing reviews can take place can result in mistimed appointments where the relevant results are not yet available, and rebooking is required
- where new roles are not properly understood – such as clinical pharmacist vs pharmacy technician or first contact physiotherapy vs community physiotherapy – referrals can be made inappropriately, resulting in re-referrals and wasted appointments
- it’s not enough to know we have a specialist in the practice – how many steps does it take to get to see them? How easy do we make it?
- when care navigators are under extreme pressure to manage high telephone demand and provide patients with appointments, it is even more important to be clear about roles and suitable allocations
3. Social vs health needs
At a simple level this type of failure demand is seen when patients attend for appointments because of a social issue (such as advice on benefits, support systems breaking down, a need for social care support) or attending with a health issue that has underlying social causes (e.g. social isolation or lifestyle related conditions). It seems as though this demand could and should be better managed elsewhere. But let’s also consider that 80% of a person’s health outcomes are related to non-health related inputs which is perhaps one of the reasons why social prescribing in general practice has been successful.
This type of failure demand presents a big opportunity for us to understand and provide for the needs of our patients, while also reducing an element of failure demand. To do so these questions are worth considering:
- how can patient data be appropriately used to identify those at risk in society and address inequalities?
- how can health risks associated with people’s relevant protected characteristics (such as age or race) be considered when care provision is being designed and delivered?
- how can we work with system partners to address the wider determinants of health that impact our communities’ health and wellbeing, such as social circumstances, environment and personal behaviours?
Quality Improvement to reduce failure demand
There is no simple answer to reducing failure demand, but using quality improvement tools allows us to understand our problems in more detail and find solutions that work for us.
As always, the Model for Improvement is a helpful way to plan and make improvements but there are other tools available that will help to understand the problem more clearly and find potential solutions.
These other tools include:
- Process mapping allows us to understand the current state, providing a measurable baseline of ‘where we are now’. Crucially this helps us to identify existing problems, delays, waste, errors and bottlenecks, as well as where a process may be unreliable. But mapping the process also brings the team together to build understanding and shared ownership of the problem and, most importantly, solutions generated to improve the process and is described in this document about Conventional process mapping.
- Ishikawa or fishbone diagrams help us to think through the causes of a problem, including possible root causes – not just symptoms. The aim is to construct the diagram with the people involved in the problem; this enables those involved to gain a shared insight into the problem, develop possible solutions and create a snapshot of the team’s collective knowledge.
The Institute for Health Improvement has this helpful video which describes how to create an Ishikawa diagram.
Appendix: data collection form – queue
Instructions: Add 1 tick for every occasion a patient was asked to call back because we weren’t able to offer the appointment needed.
Week commencing: Name:
|
Monday |
Tuesday |
Wednesday |
Thursday |
Friday |
|
|
|
|
|
|
Total: |
Total: |
Total: |
Total: |
Total: |
Other resources and tools you may need when using this guidance
- Demand and capacity data collection spreadsheet which is available as a spreadsheet to download from the national General Practice Improvement programme resources page
- Demand and capacity estimation calculator which is available as a spreadsheet to download from the national General Practice Improvement programme resources page
- Avoidable appointments collection spreadsheet which is available as a spreadsheet to download from the national General Practice Improvement programme resources page
- Tally chart to record the queue (see appendix)
- Process mapping guidance
- GP Demand and Capacity planning tool – implementation toolkit
How to align capacity with demand in general practice
Bakhai M, Vallely D, Fox Z, Joyce J, Hinde R, Durrant N, Gillam M, Blackaby C
This guidance was prepared by NHS England’s Primary Care Transformation team as part of the national General Practice Improvement programme.
If you have any questions or would like to send feedback, please get in touch: england.pctgpip@nhs.net.
Publication reference: PRN00615_i