
Executive summary
This briefing draws on official statistics published on our website.
1. 6% of patients attending A&E were admitted, transferred or discharged within four hours, which is below the 95% standard. This compares to 74.0% in May 2024 and 73.4% in June 2023.
2. Ambulance services answered 800,288 calls to 999, or 26,676 per day, an increase of 1% compared to June 2023. There were 367,420 incidents where a patient was conveyed to A&E, 3% more than in June 2023. The average ambulance response time for a category 2 call was 34 minutes and 38 seconds.
3. As of the end of May, on the total waiting list there were 7.61 million waits for procedures and appointments and an estimated 6.38 million people waiting for care.The number of patients waiting more than 65 weeks for treatment was 55,955 at the end of May.
4. Levels of Urgent Suspected Cancer referrals have remained at high levels, with the 12,695 patients seen per working day a new record high, exceeding the previous record of 12,554 patients seen per working day in May 2024.
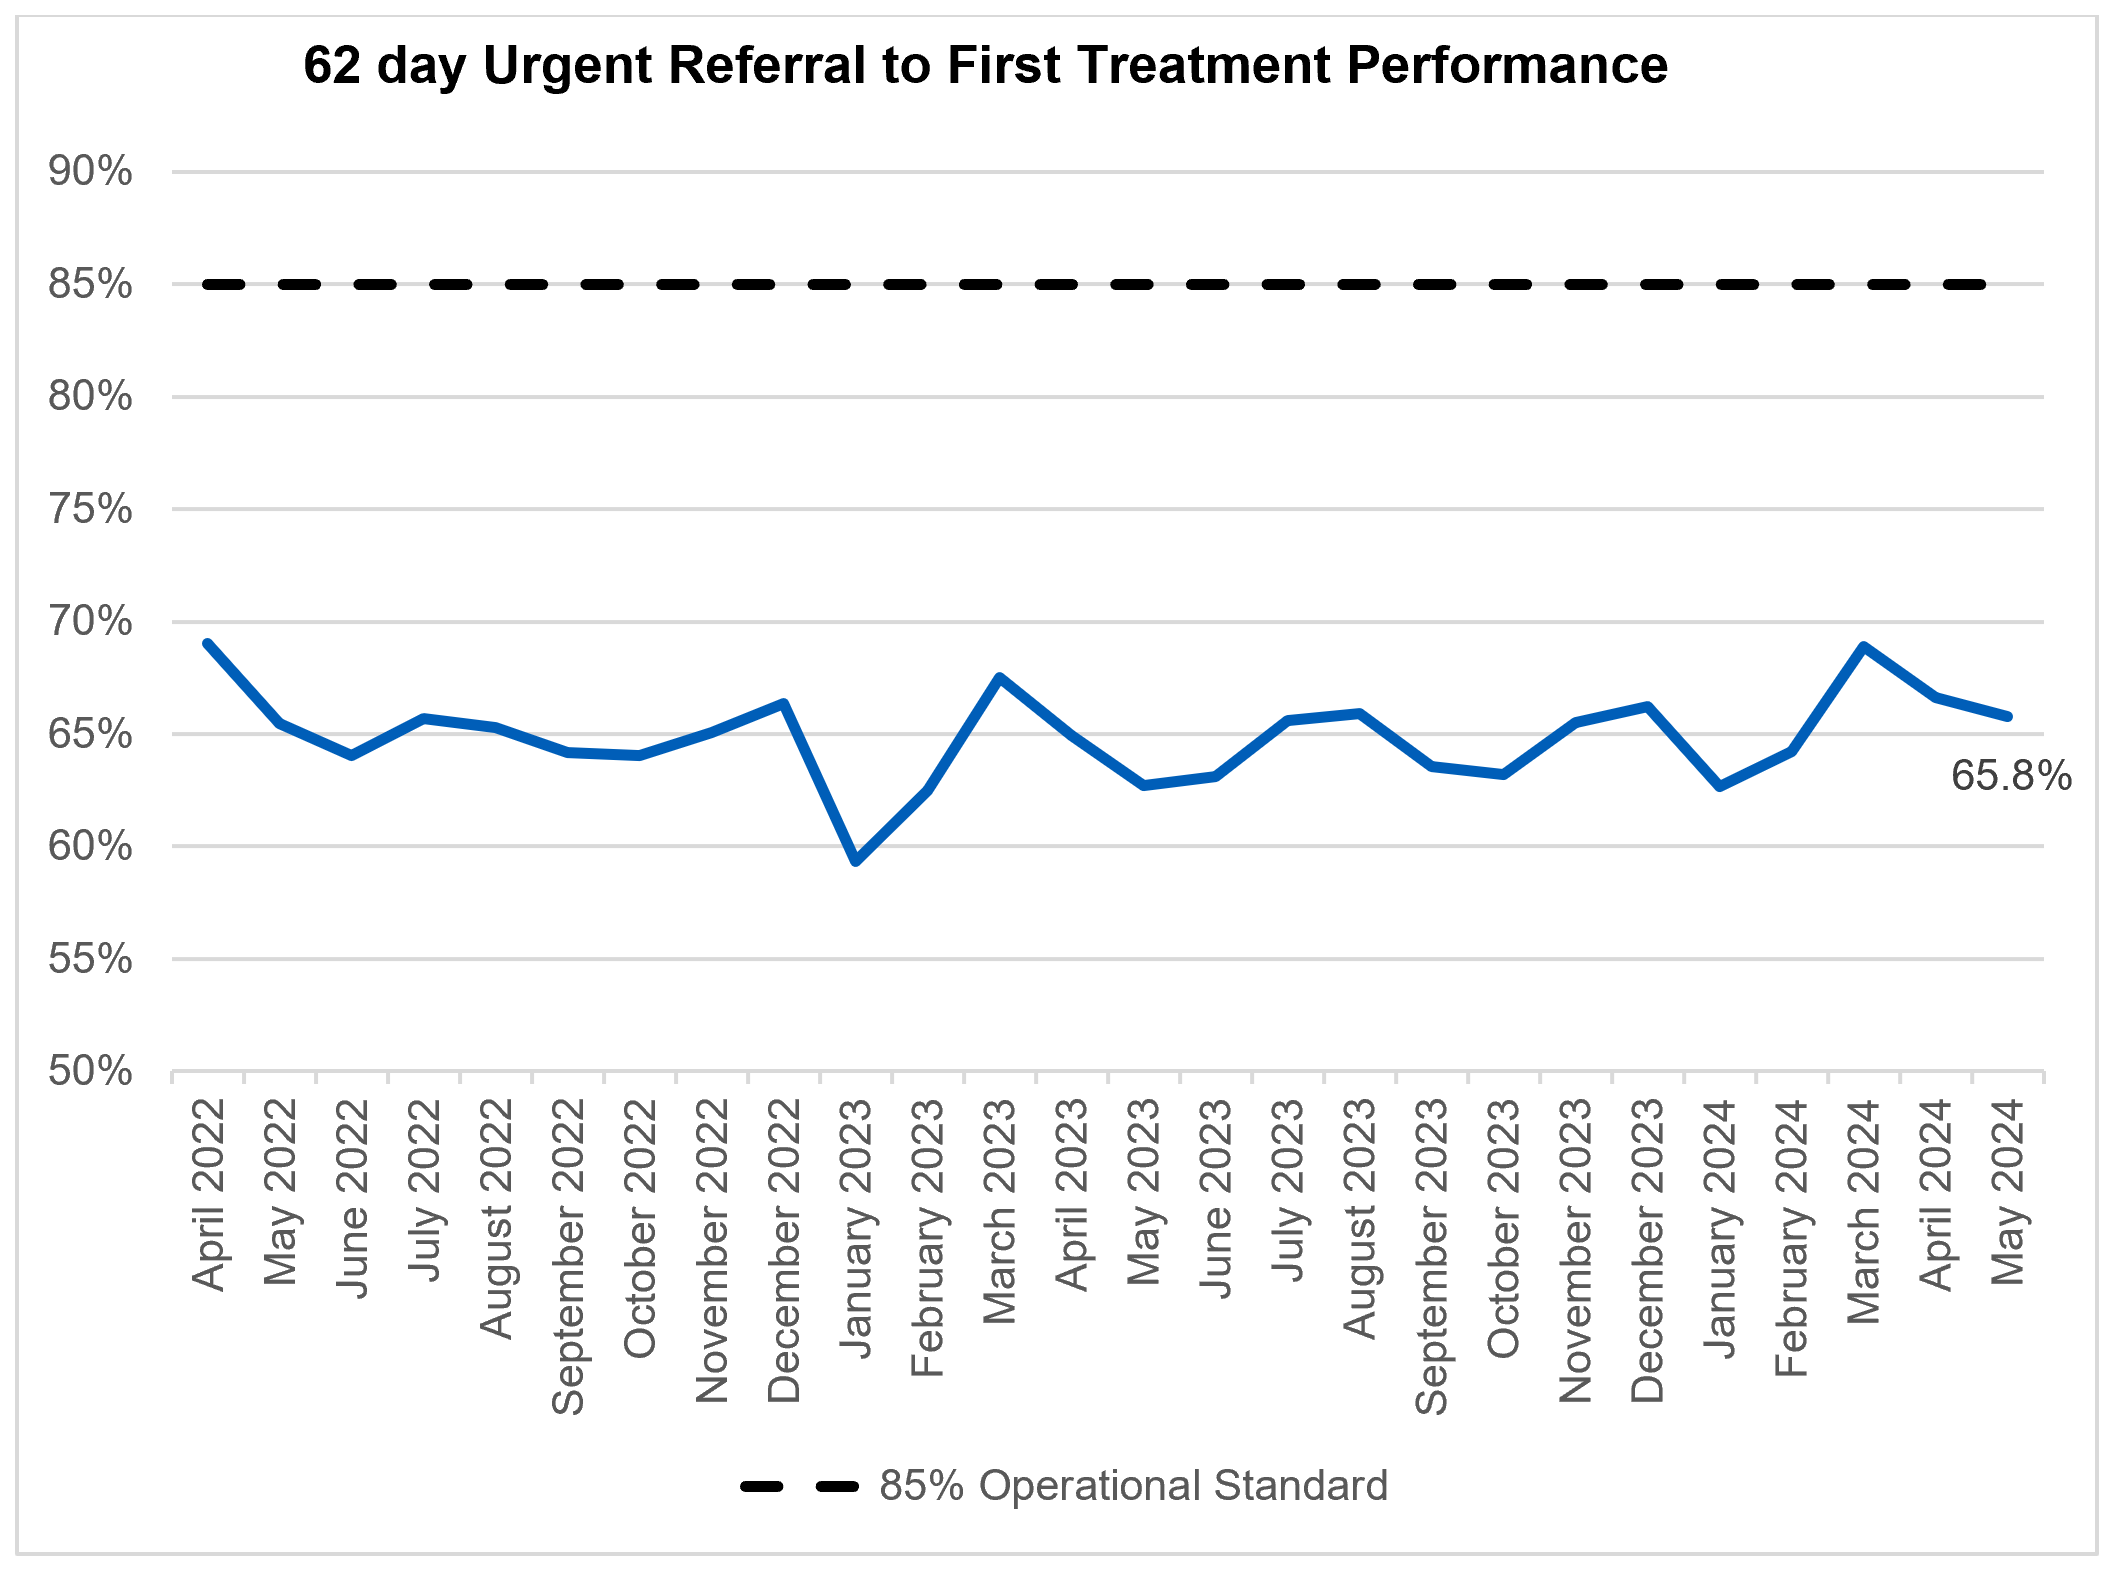
5. In May, performance against the cancer 62 day Urgent Referral to First Treatment standard was 65.8%, which was 3.1% higher than at the same point last year, but still well below where we want to see it. The NHS has set the ambition to improve this to 70% to March 2025, as a first step in recovering performance to the 85% standard.
6. As of April 2024, 10% of those still waiting for a second contact in Adult Community Mental Health services have been waiting at least 116 weeks (812 days). This has increased from 100 weeks (703 days) in December 2023.
Urgent and emergency care
Urgent and emergency (UEC) care services saw high demand in June and there was an increase in 999 calls during the warmer weather.
The provisional figures published for June indicate that 9.8% of patients spent 12 hours from arrival in A&E. This is down from 10.0% last month.
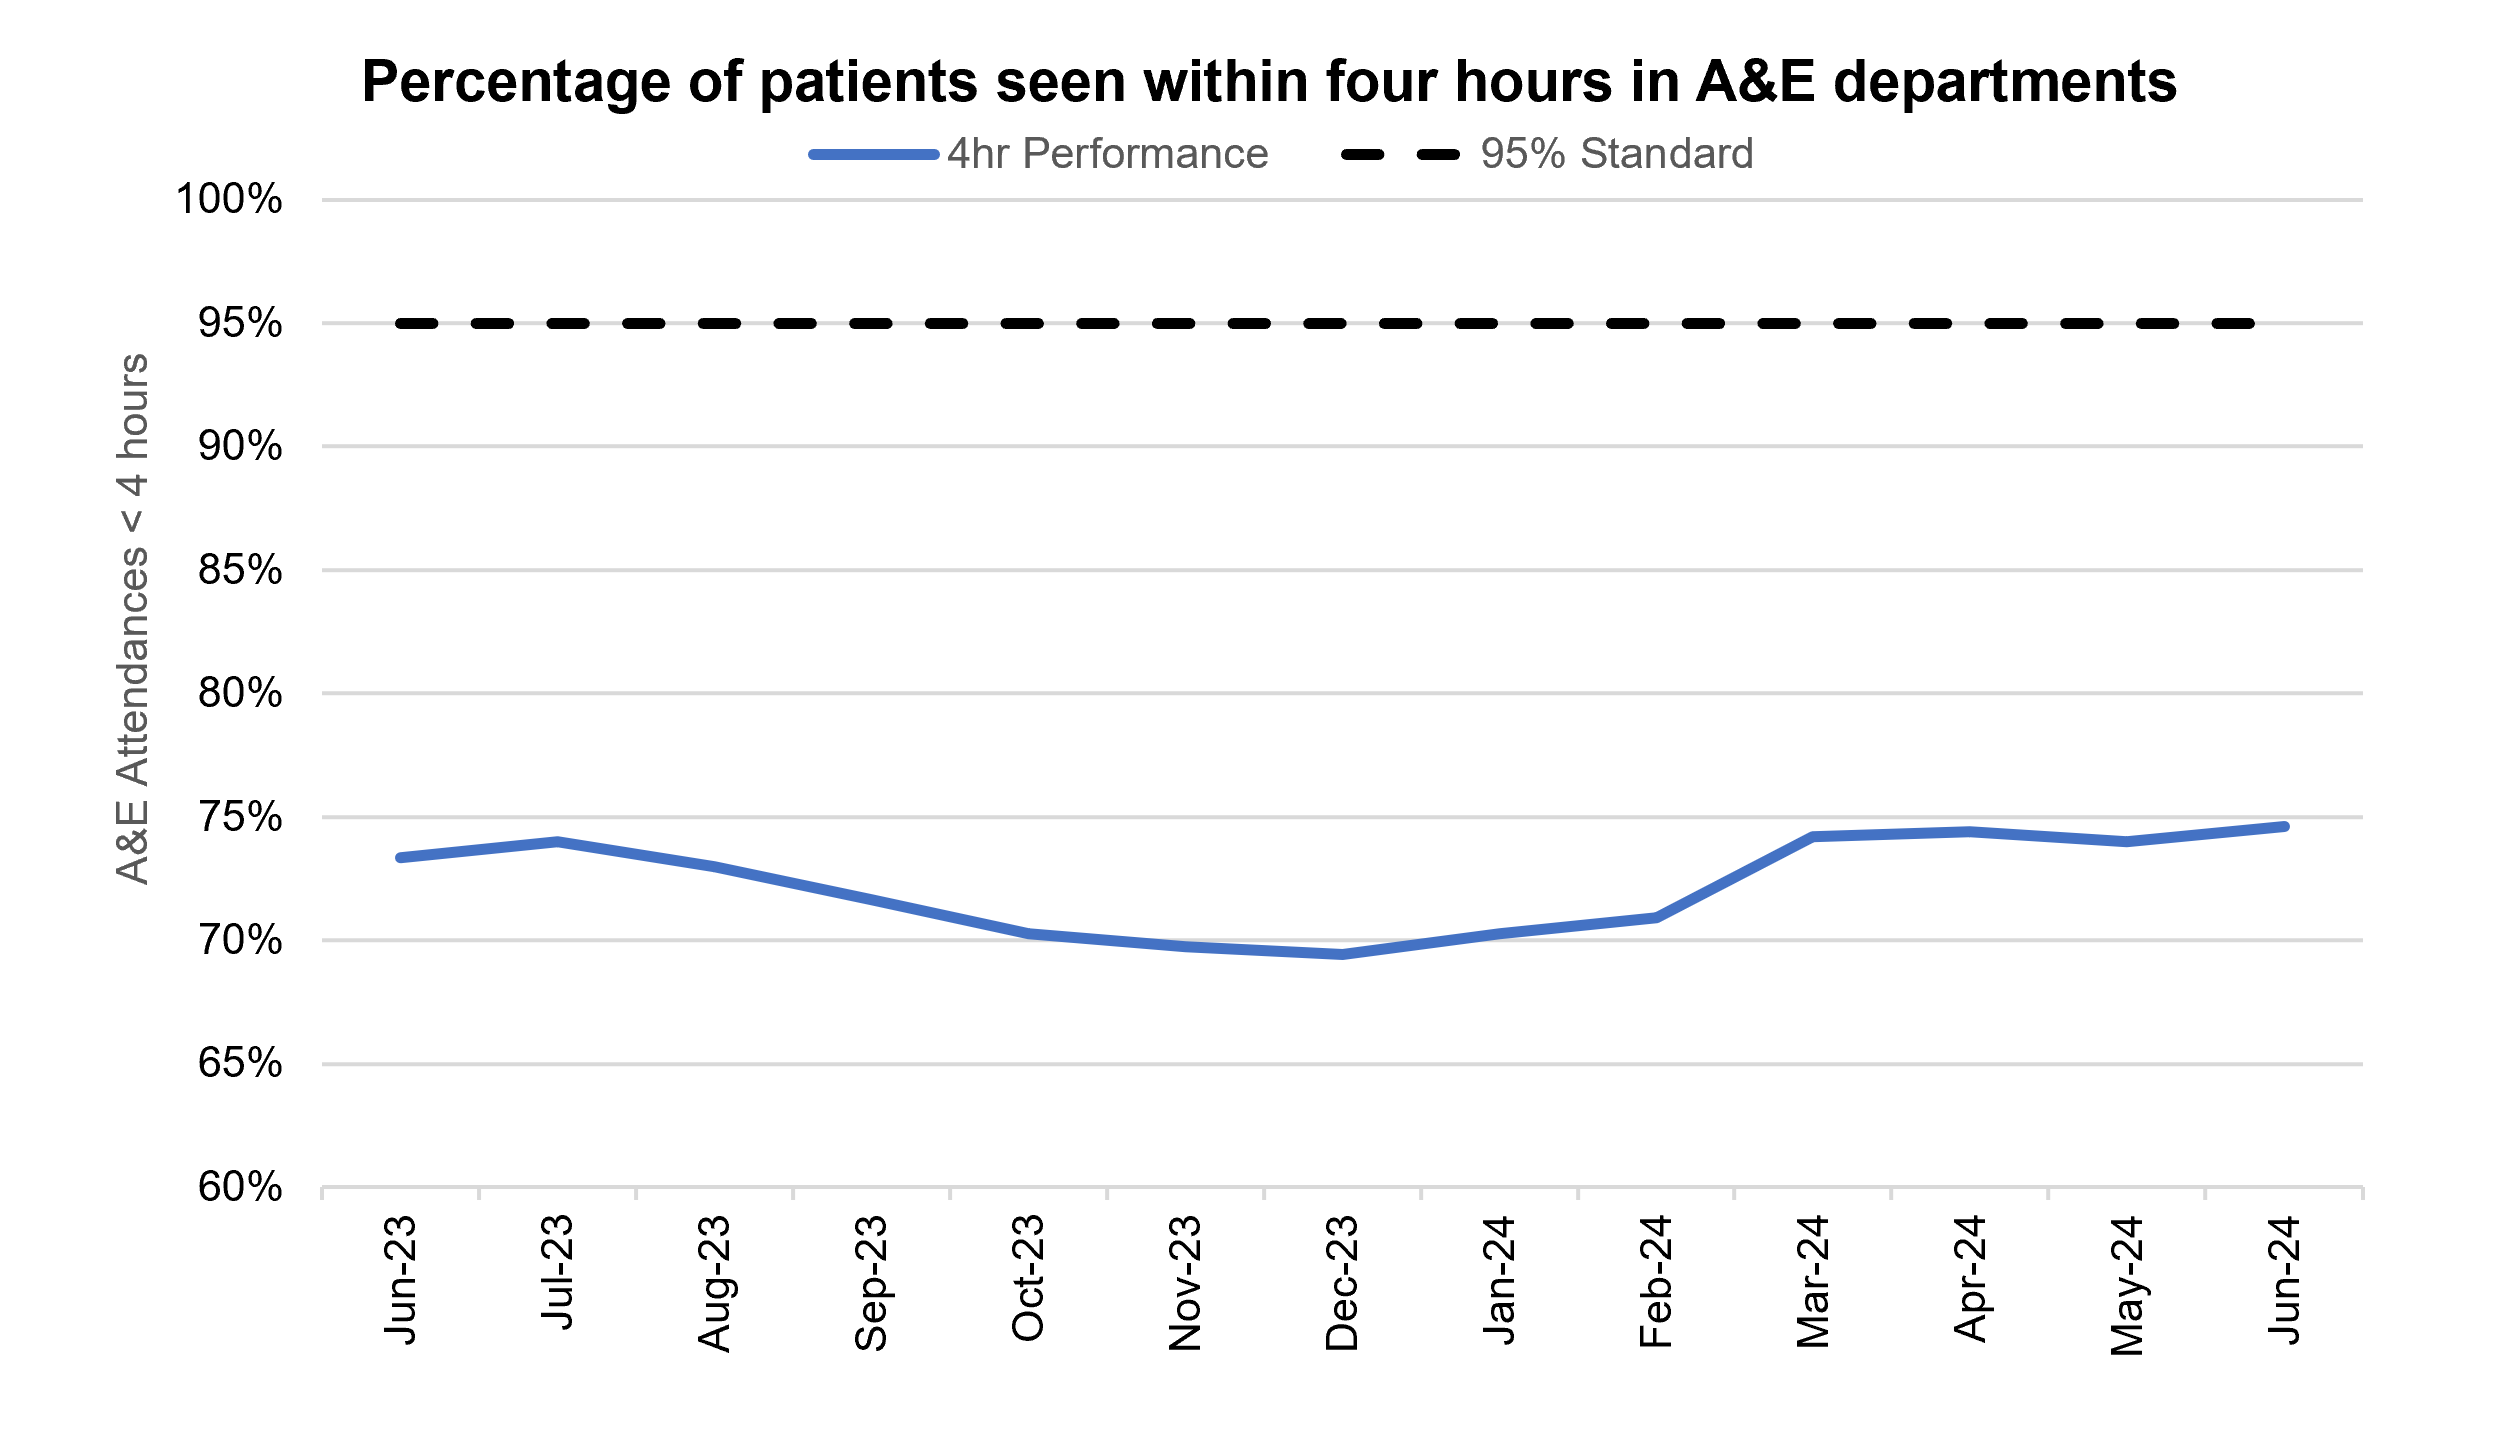
74.6% of patients attending A&E were admitted, transferred or discharged within four hours, which is below the 95% standard. This compares to 74.0% in May 2024 and 73.4% in June 2023.
There was an increase in attendances in A&Es across England to 2,294,065, an average of 76,469 per day. This is almost 1.9% lower than May’s daily average and 3.1% higher than June 2023.
Percentage of patients seen within four hours in A&E departments
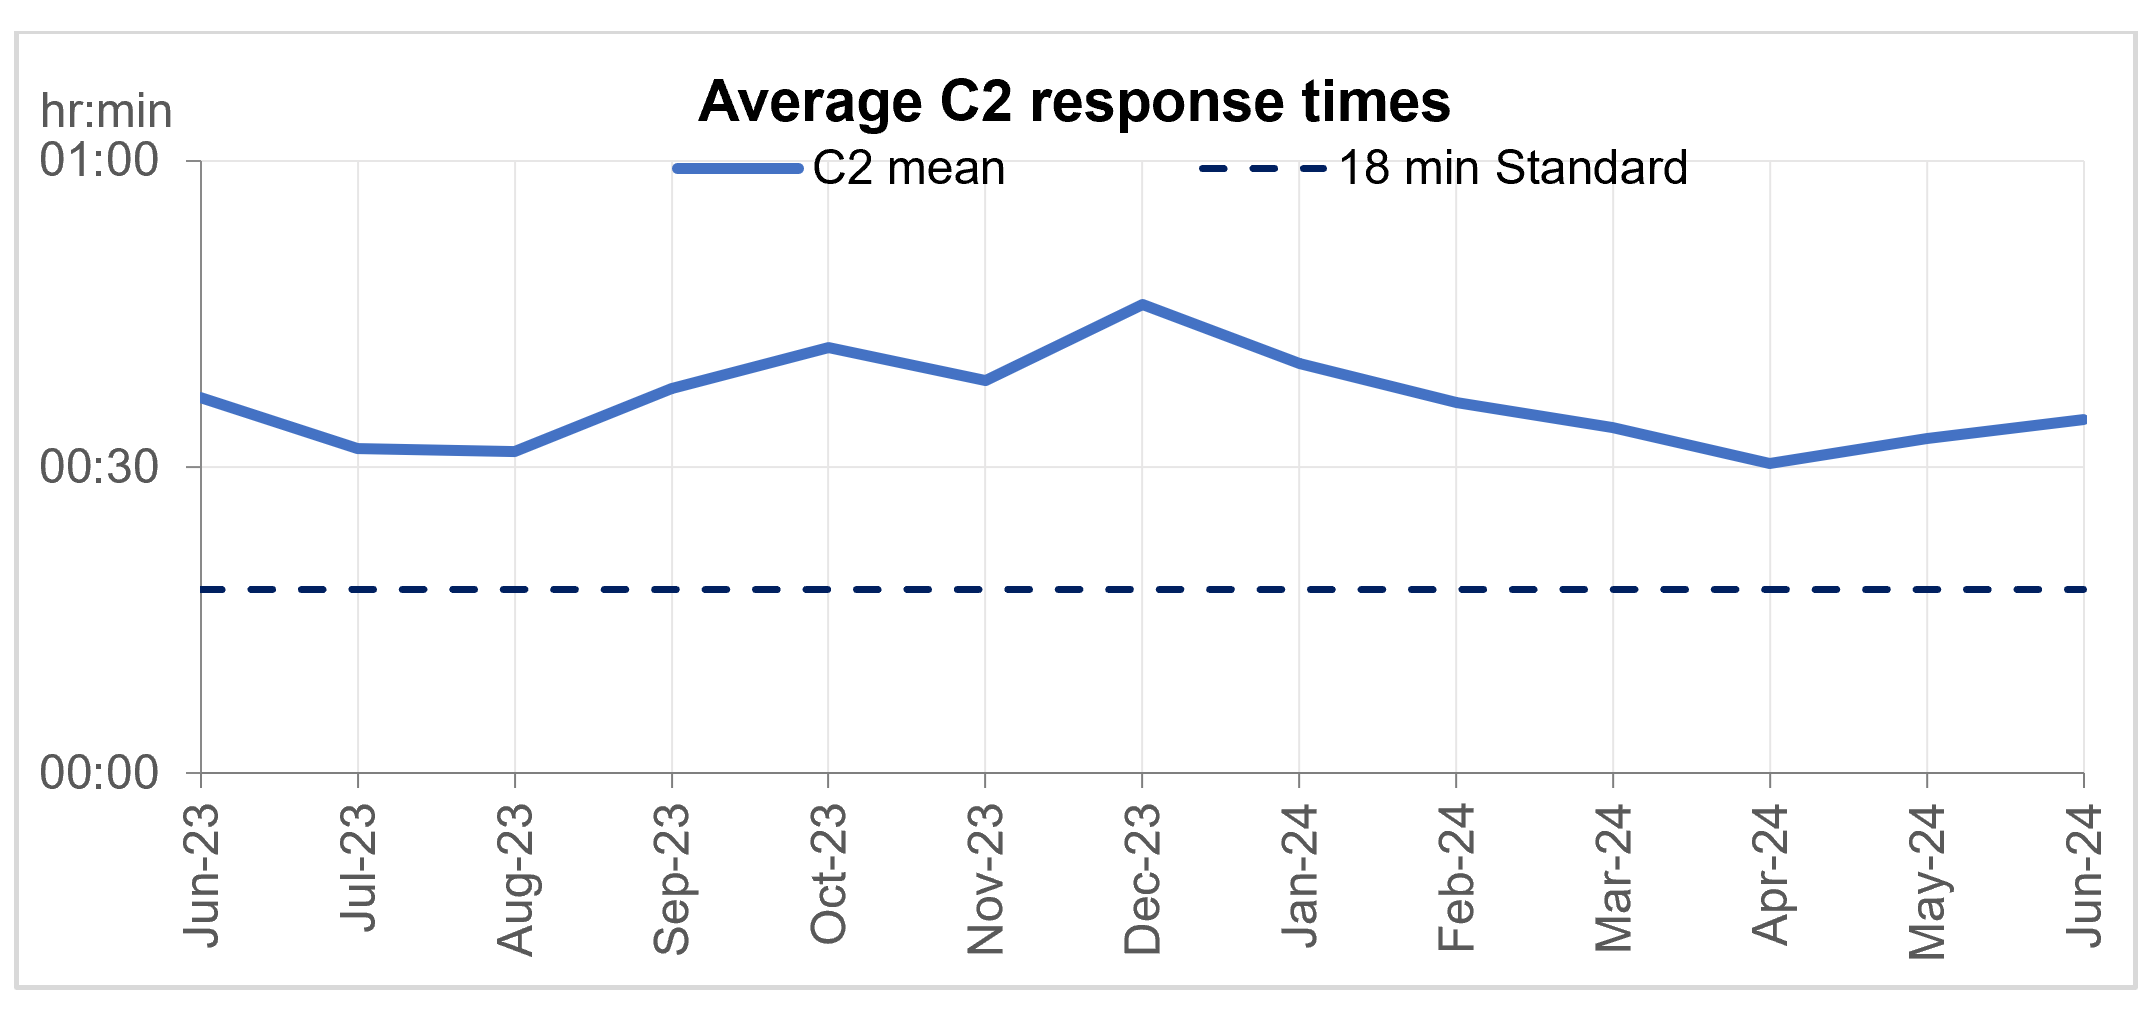
Ambulance services answered 800,288 calls to 999, or 26,676 per day, an increase of 1% compared to June 2023. There were 367,420 incidents where a patient was conveyed to A&E, 3% more than in June 2023.
The average ambulance response time for a category 2 call was 34 minutes and 38 seconds.
Average C2 response times
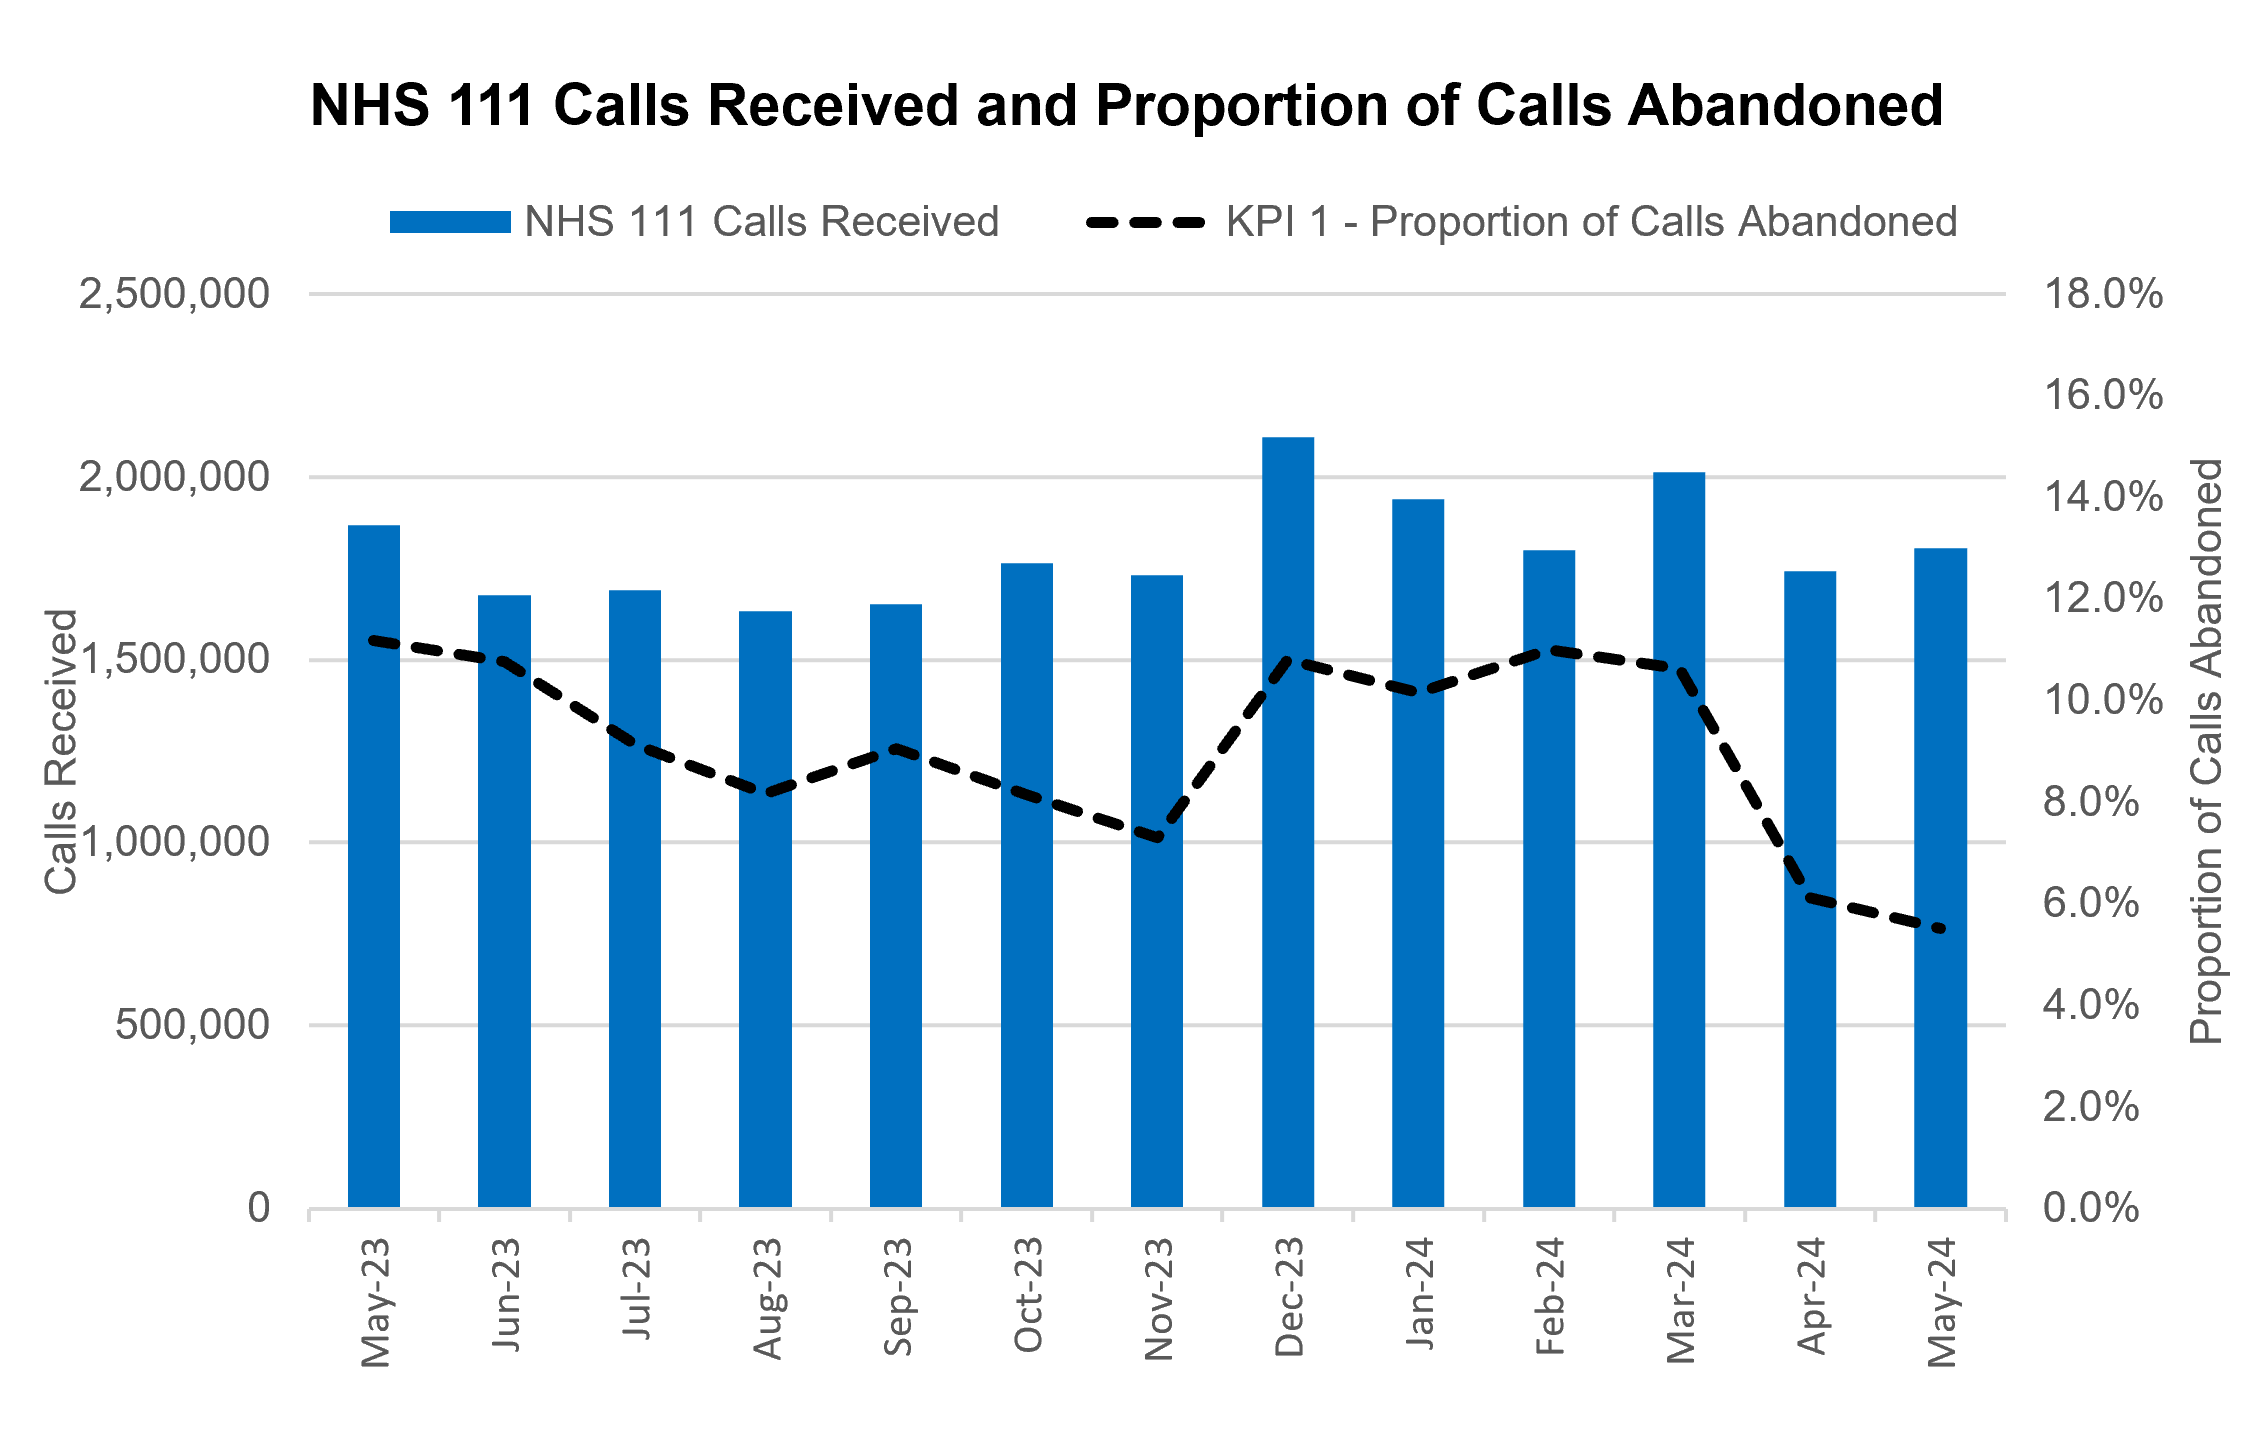
NHS 111 received 1.8 million calls (c. 58.2 thousand per day) in May. Demand was 3.4% down year on year and 3.6% below volumes received in April 2024.
The proportion of calls abandoned dropped 0.6% percentage points from the previous month (now at 5.5%) and the average speed to answer reduced by 10 seconds to 94.
NHS 111 calls received and proportion of calls abandoned
There has been a change in how the data is collected for the acute discharge sitrep. This is the first month of using the new data collection system and not all organisations have been able to submit, there will be a decrease in the data volumes for bed numbers.
Elective recovery
As of the end of May, on the total waiting list there were 7.61 million waits for procedures and appointments and an estimated 6.38 million people waiting for care.
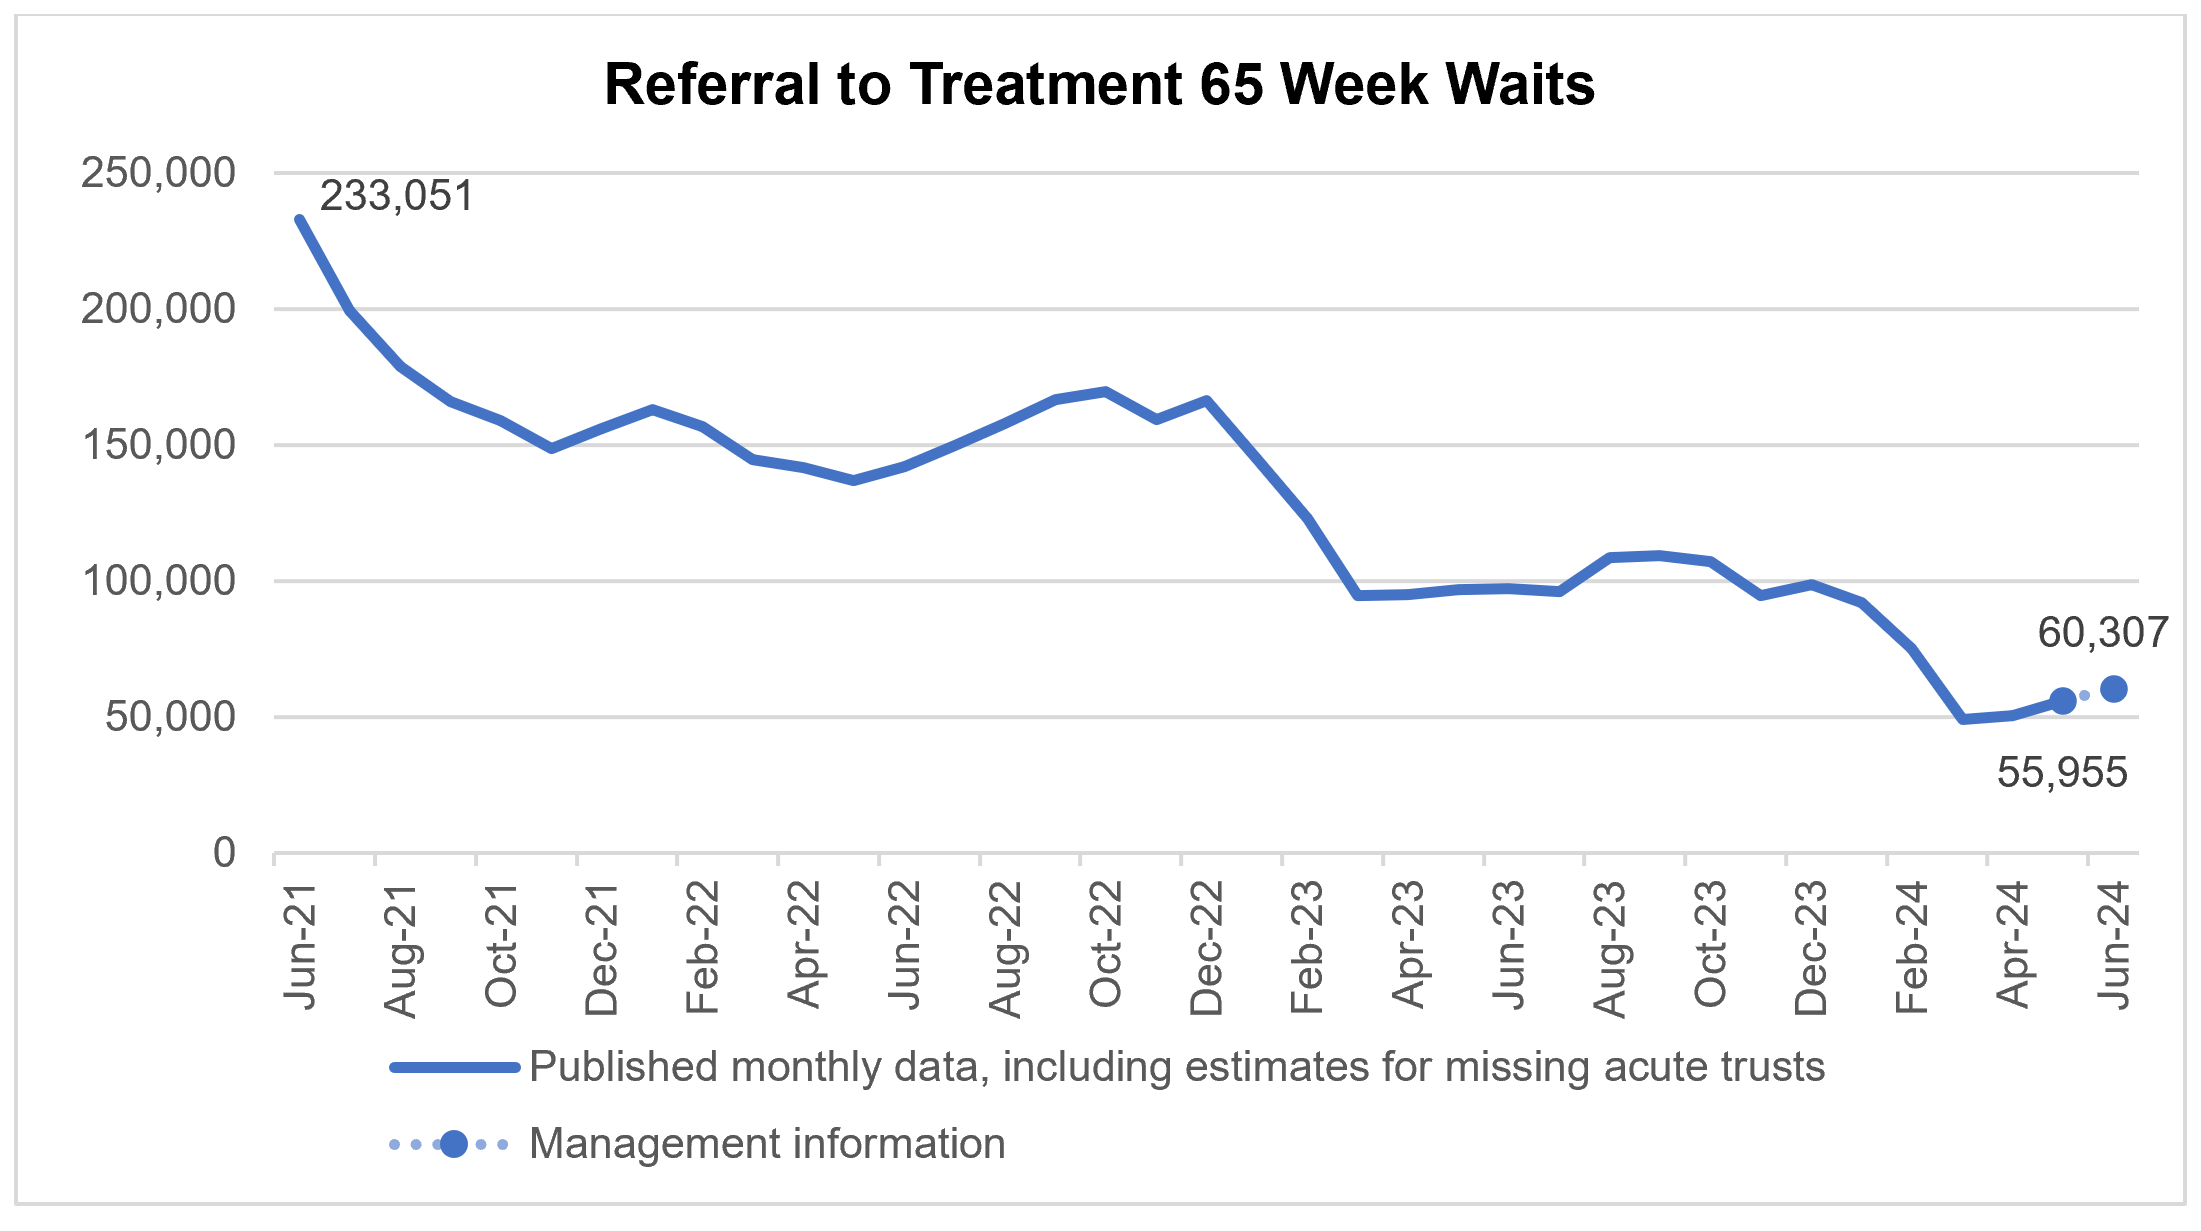
The number of patients waiting more than 65 weeks for treatment was 55,955 at the end of May, compared to 96,802 at the end of May 2023. Additional management data* suggests this number has increased to 60,307 patients waiting more than 65 weeks for treatment as of the end of June.
* Management information for the latest month is taken from the Waiting List Minimum Dataset which is subject to less validation than the published monthly figures and does not include estimates for missing providers. (135 acute trusts submitted data for the latest month).
Referral to treatment 65 week waits
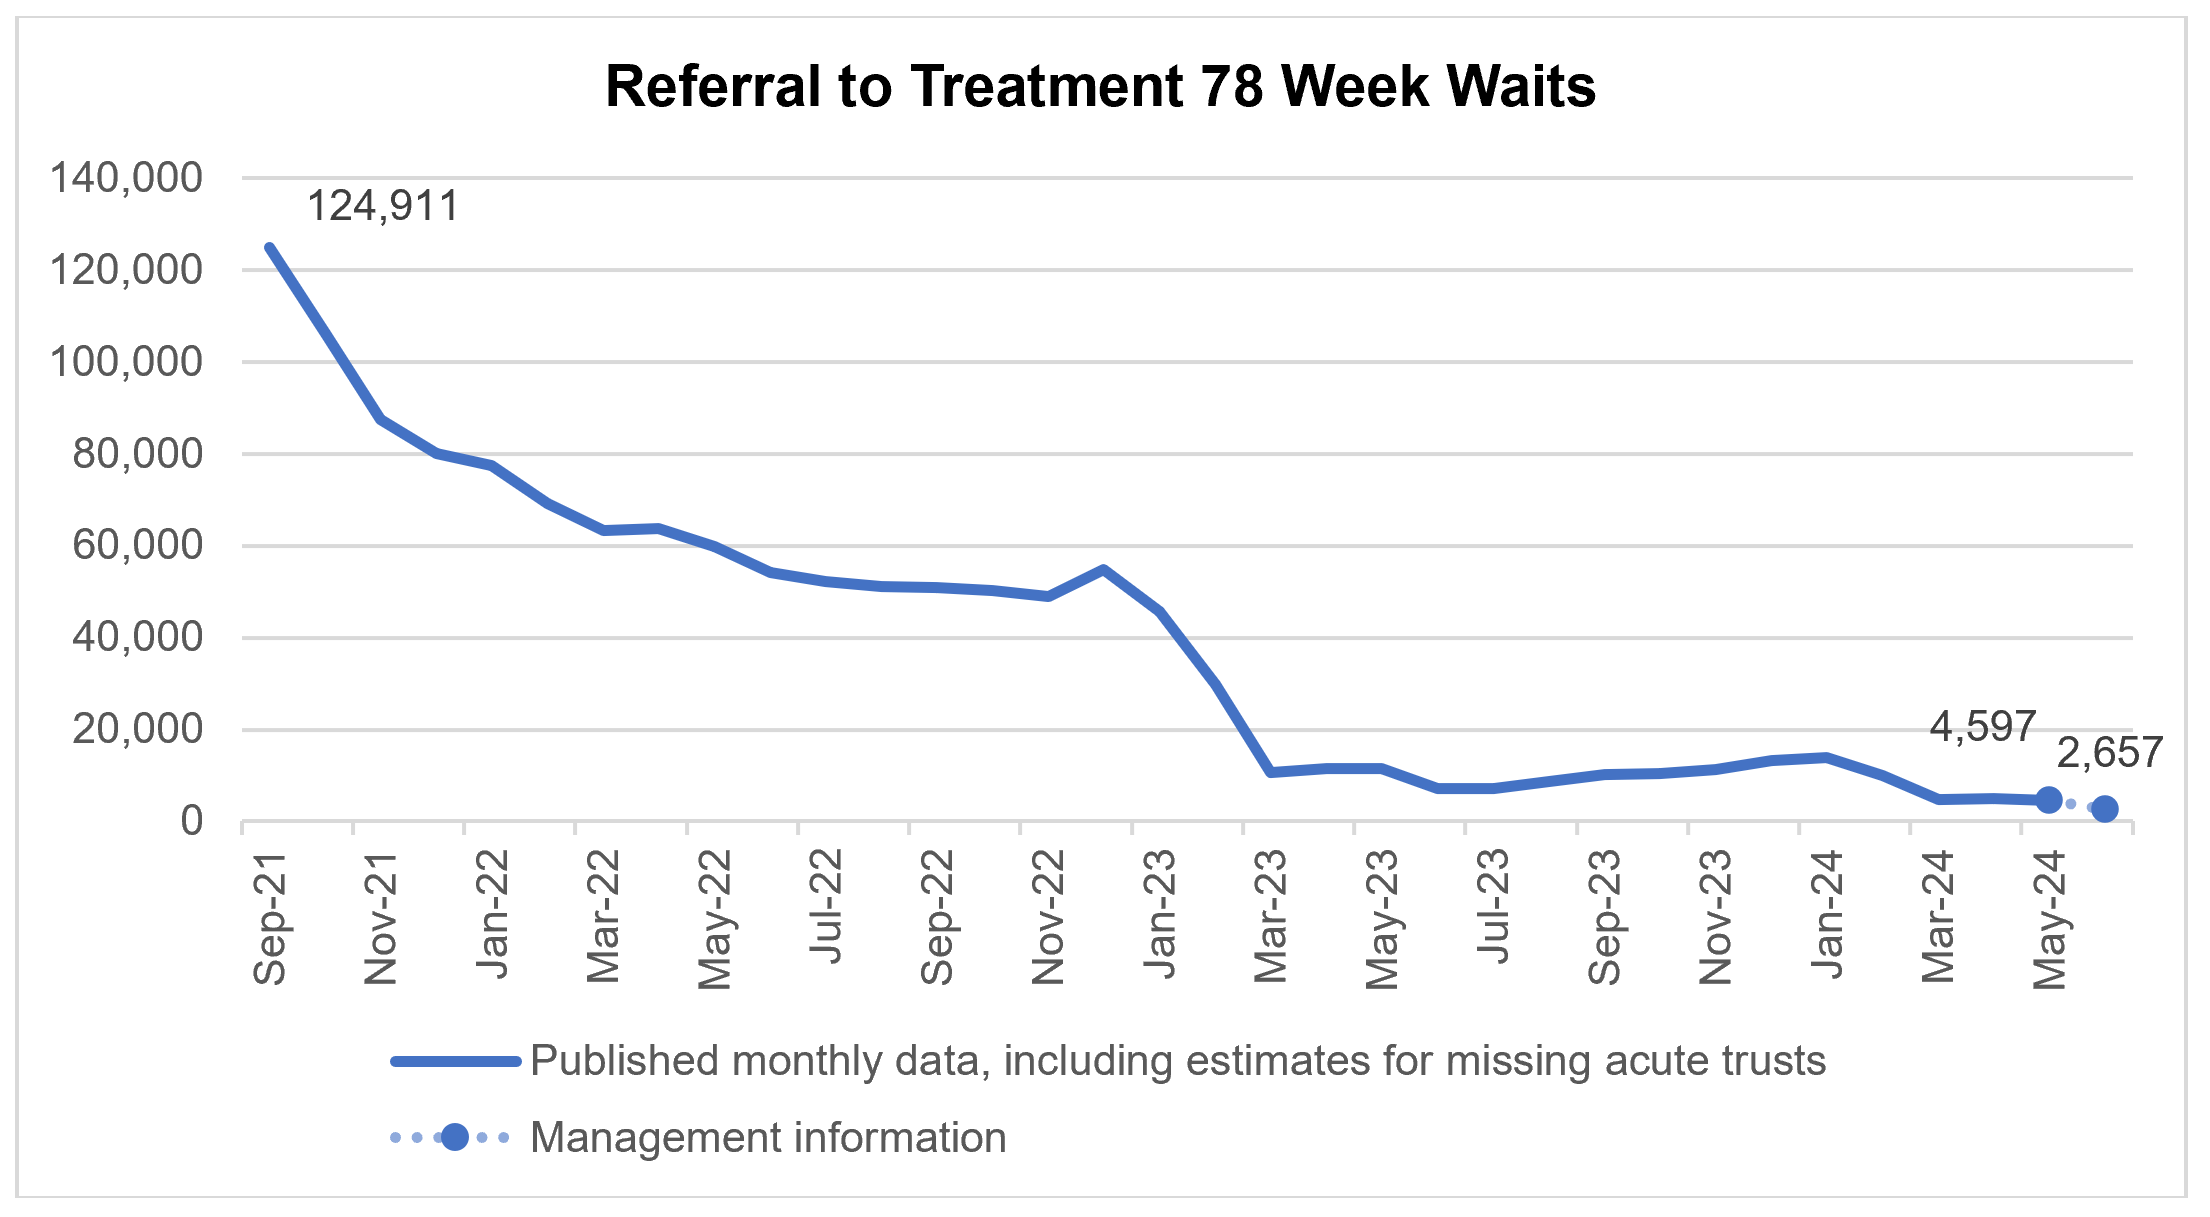
There has been a reduction in the longest waits for care, 4,597 patients were waiting more than 78 weeks for treatment at the end of May, compared to 11,446 at the end of May 23 (down 59.8%). The system experienced industrial action in June, additional management data* suggests 2,657 patients were waiting more than 78 weeks for treatment as of the end of June.
* Management information for the latest month is taken from the Waiting List Minimum Dataset which is subject to less validation than the published monthly figures and does not include estimates for missing providers. (135 acute trusts submitted data for the latest month).
Referral to treatment 78 week waits
Patients are still experiencing waiting times of more than 104 weeks for treatment with 259 patients waiting for treatment at the end of May, compared to 482 at the end of May 23. Additional management data suggests this number reduced between May and June, with 109 patients waiting more than 104 weeks for treatment at the end of June.
Cancer
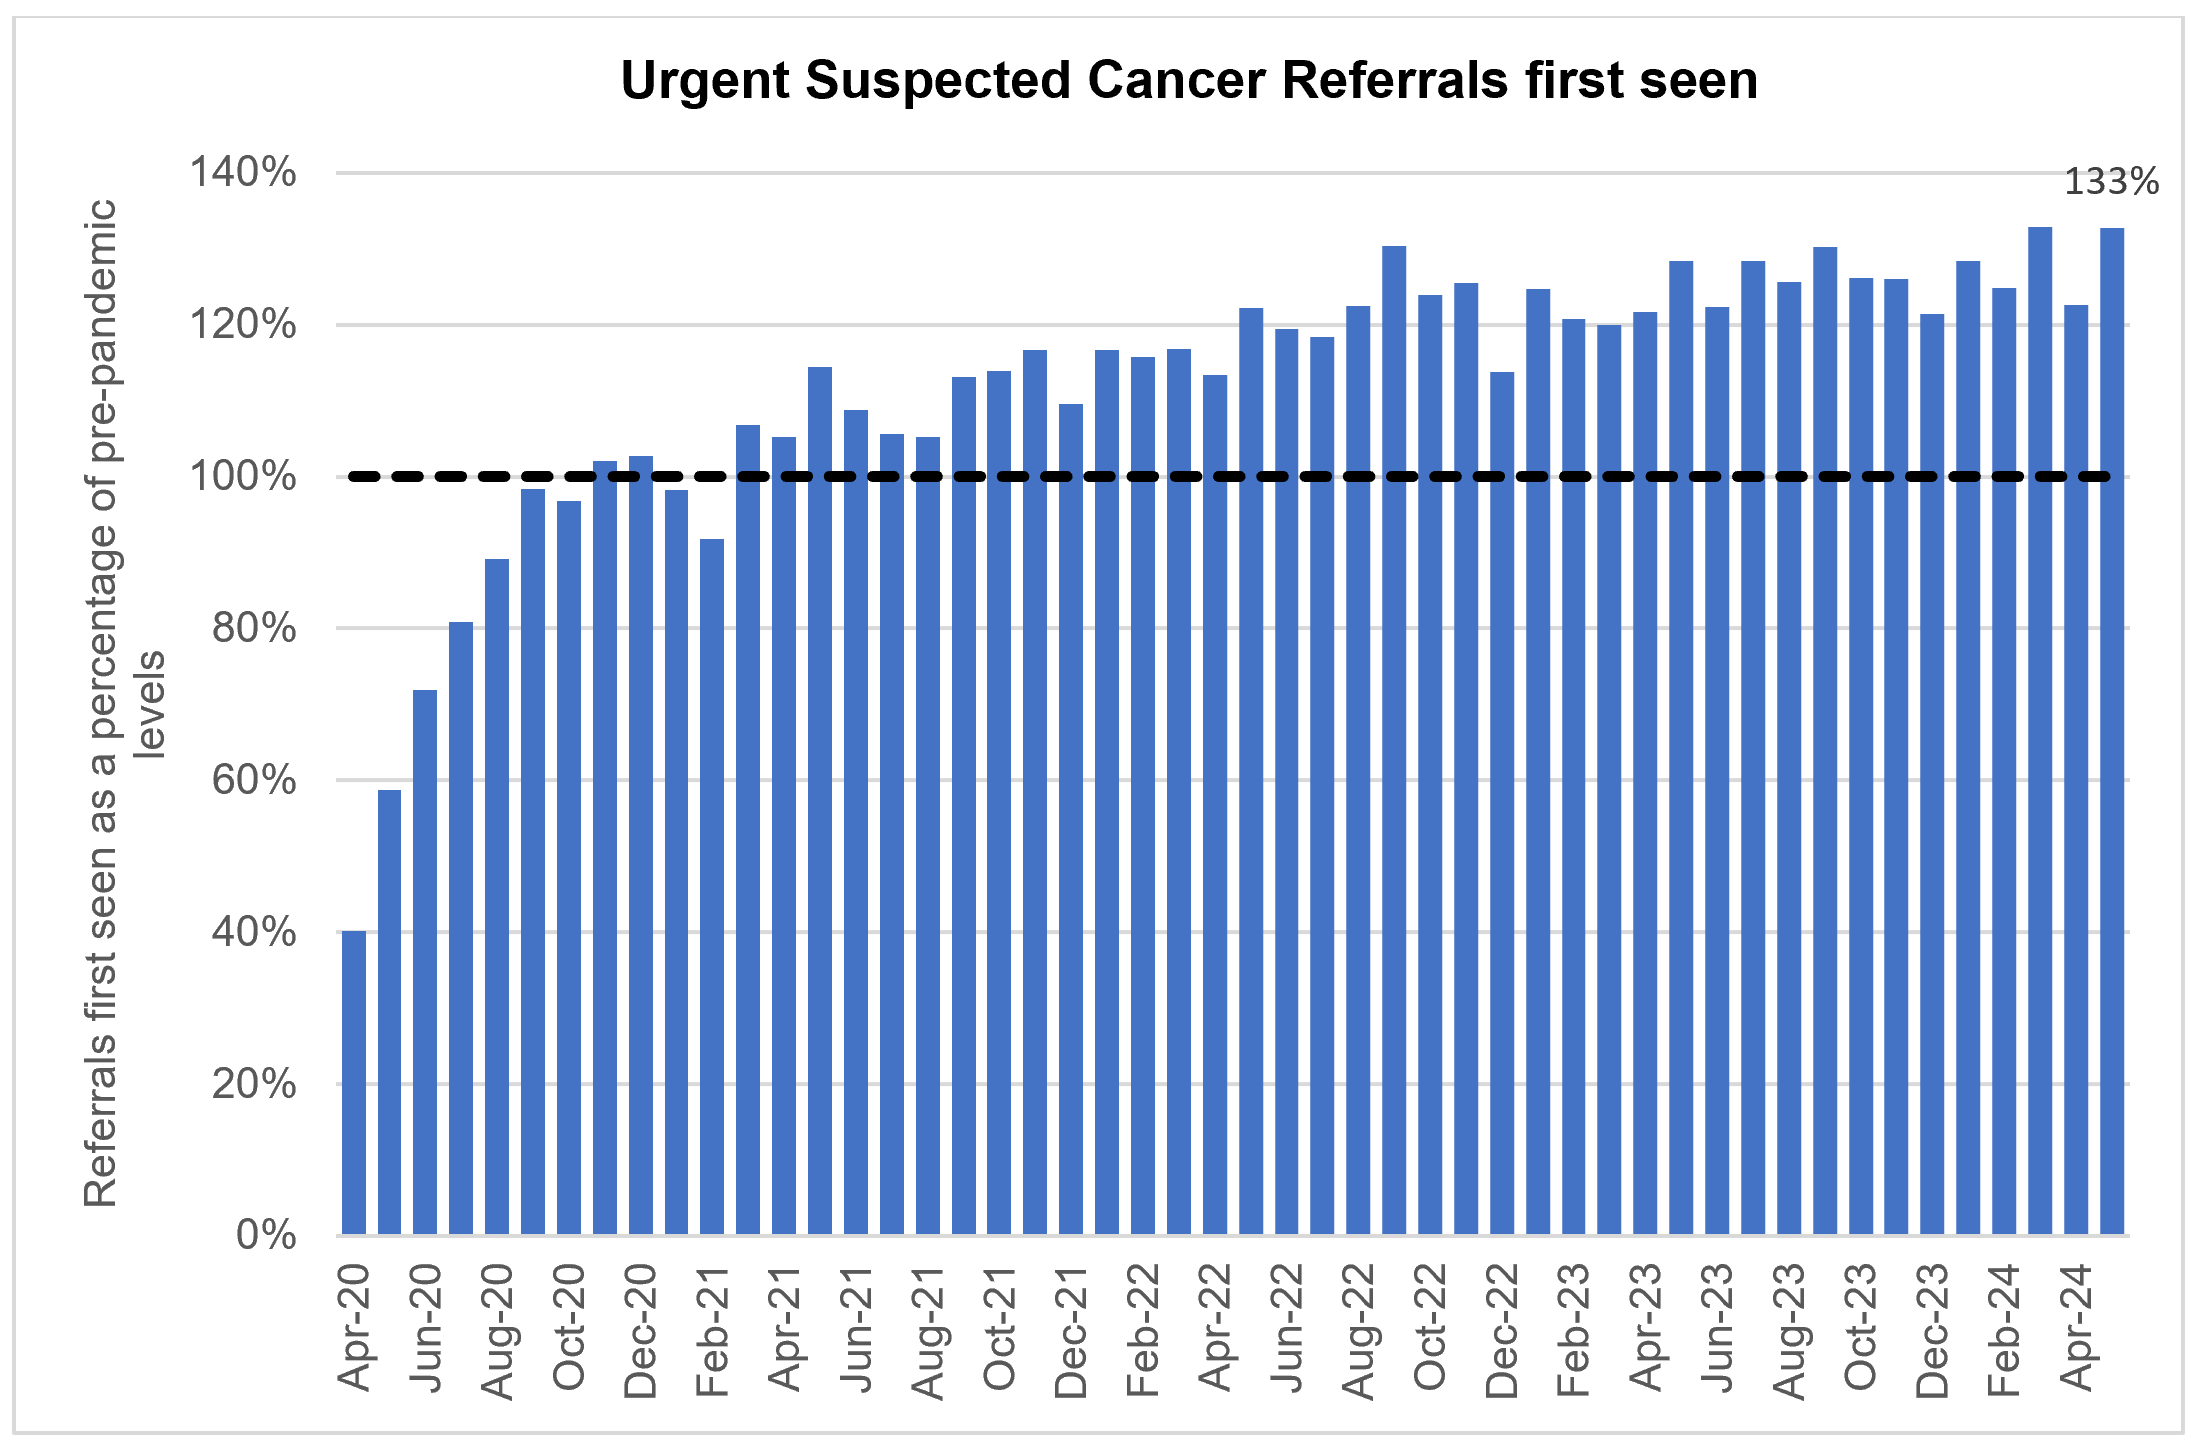
Levels of Urgent Suspected Cancer referrals have remained at high levels, with the 12,695 patients seen per working day a new record high, exceeding the previous record of 12,554 patients seen per working day in May 2024. This is 33% more referrals than the NHS was seeing before the pandemic – the equivalent of 3,000 more patients per working day.
Treatment activity was also at its highest ever level with over 1,400 patients starting Cancer Treatment per working day.
Despite these activity levels, there have been improvements in all Cancer Waiting Times standards compared to the same month last year.
Urgent suspected cancer referrals first seen
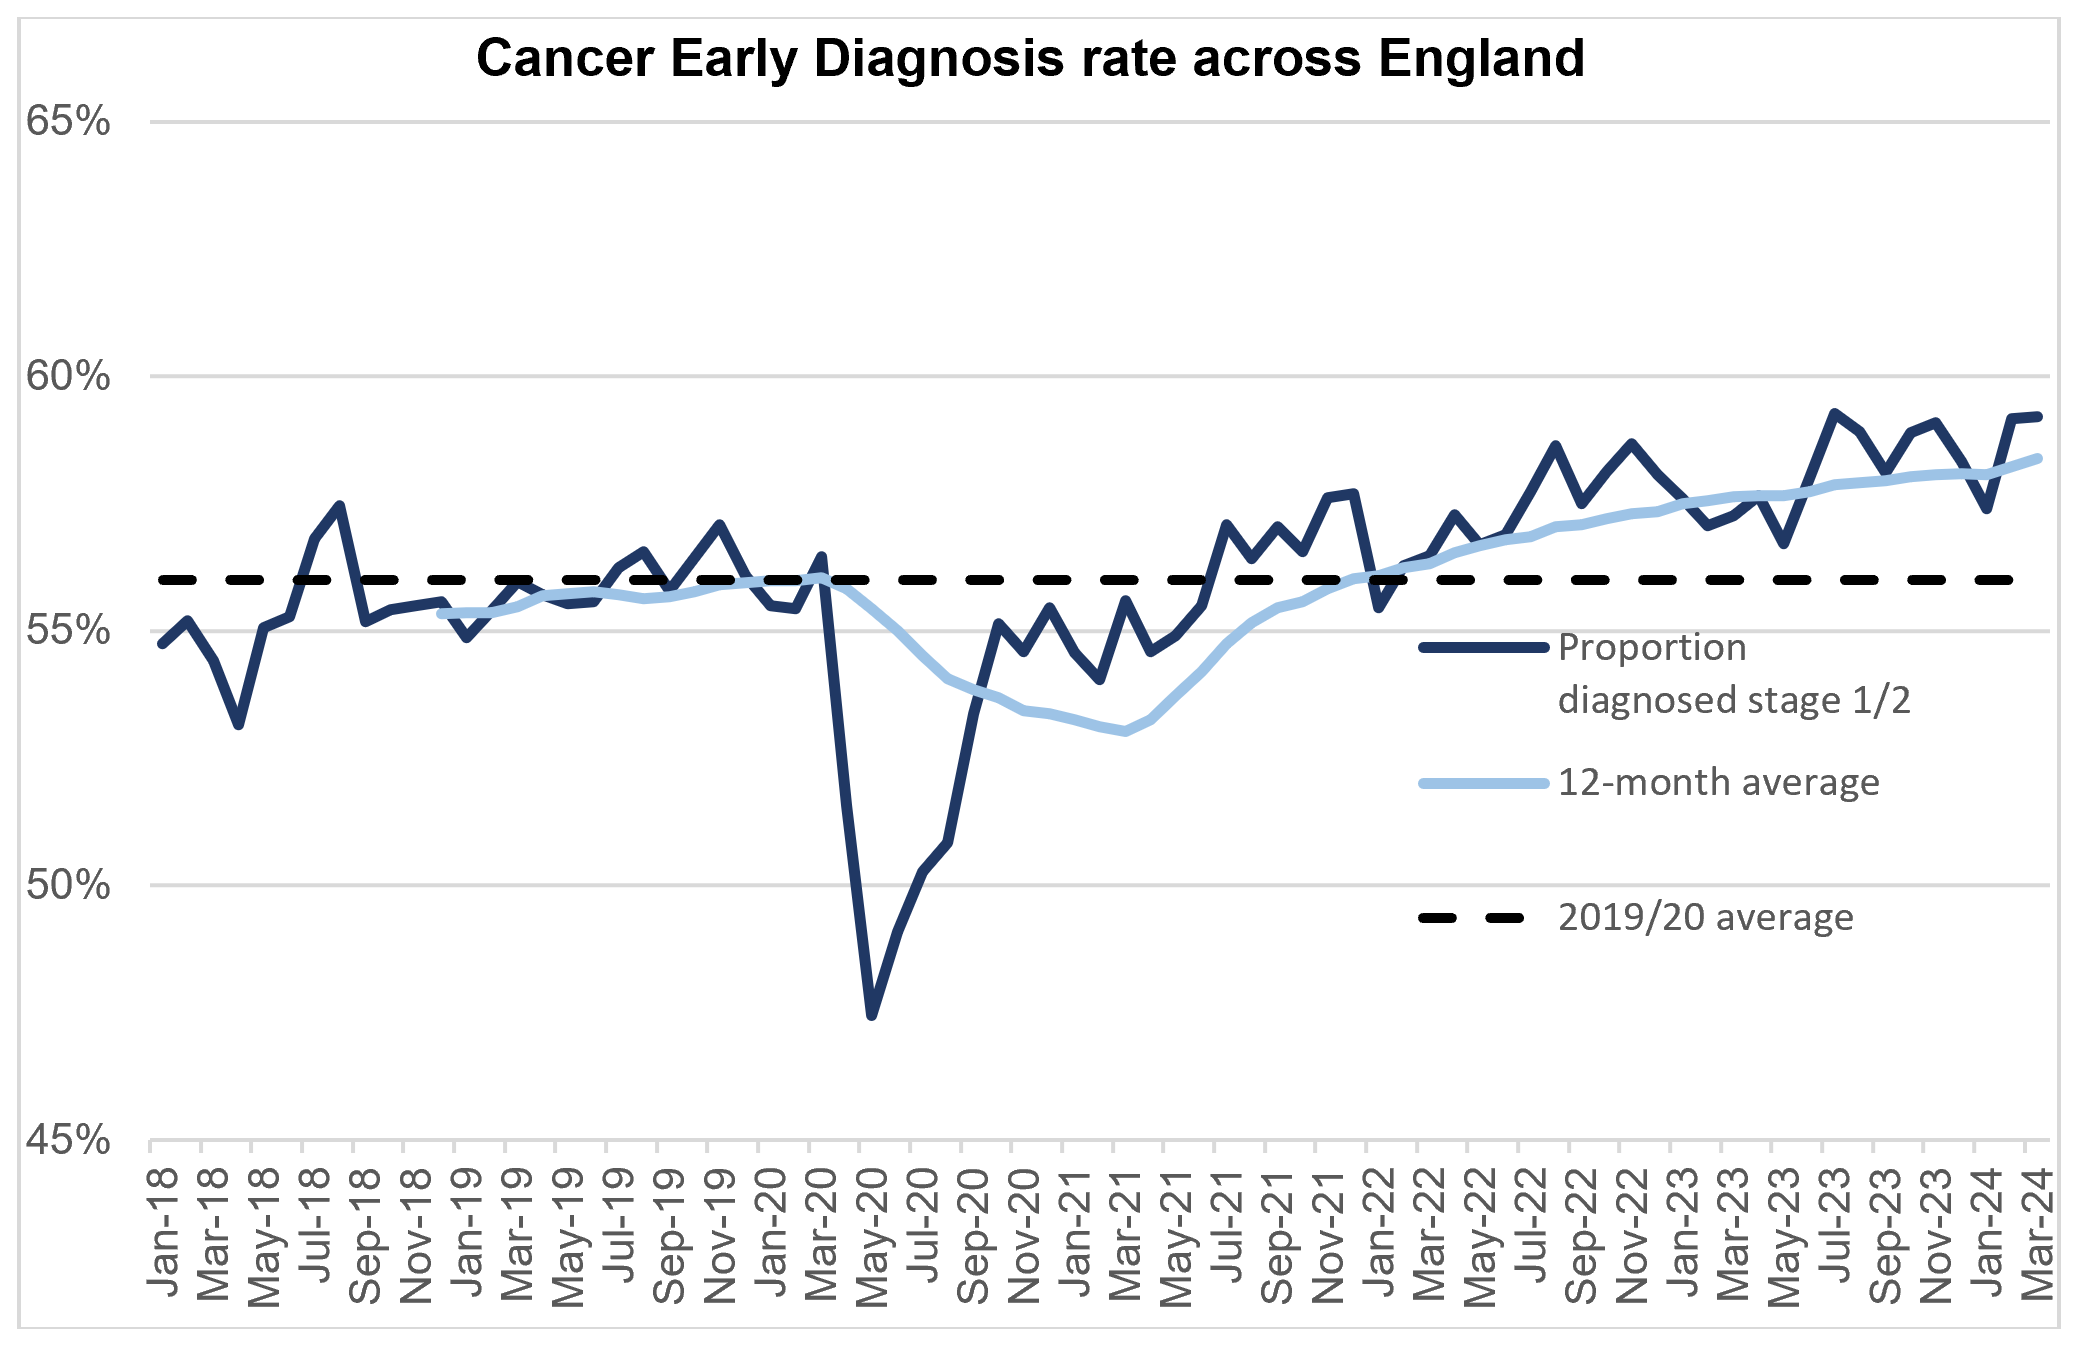
The increase in referrals has contributed to increases in early diagnosis, which are now about 2 percentage points higher than before the pandemic.
Cancer early diagnosis rate across England
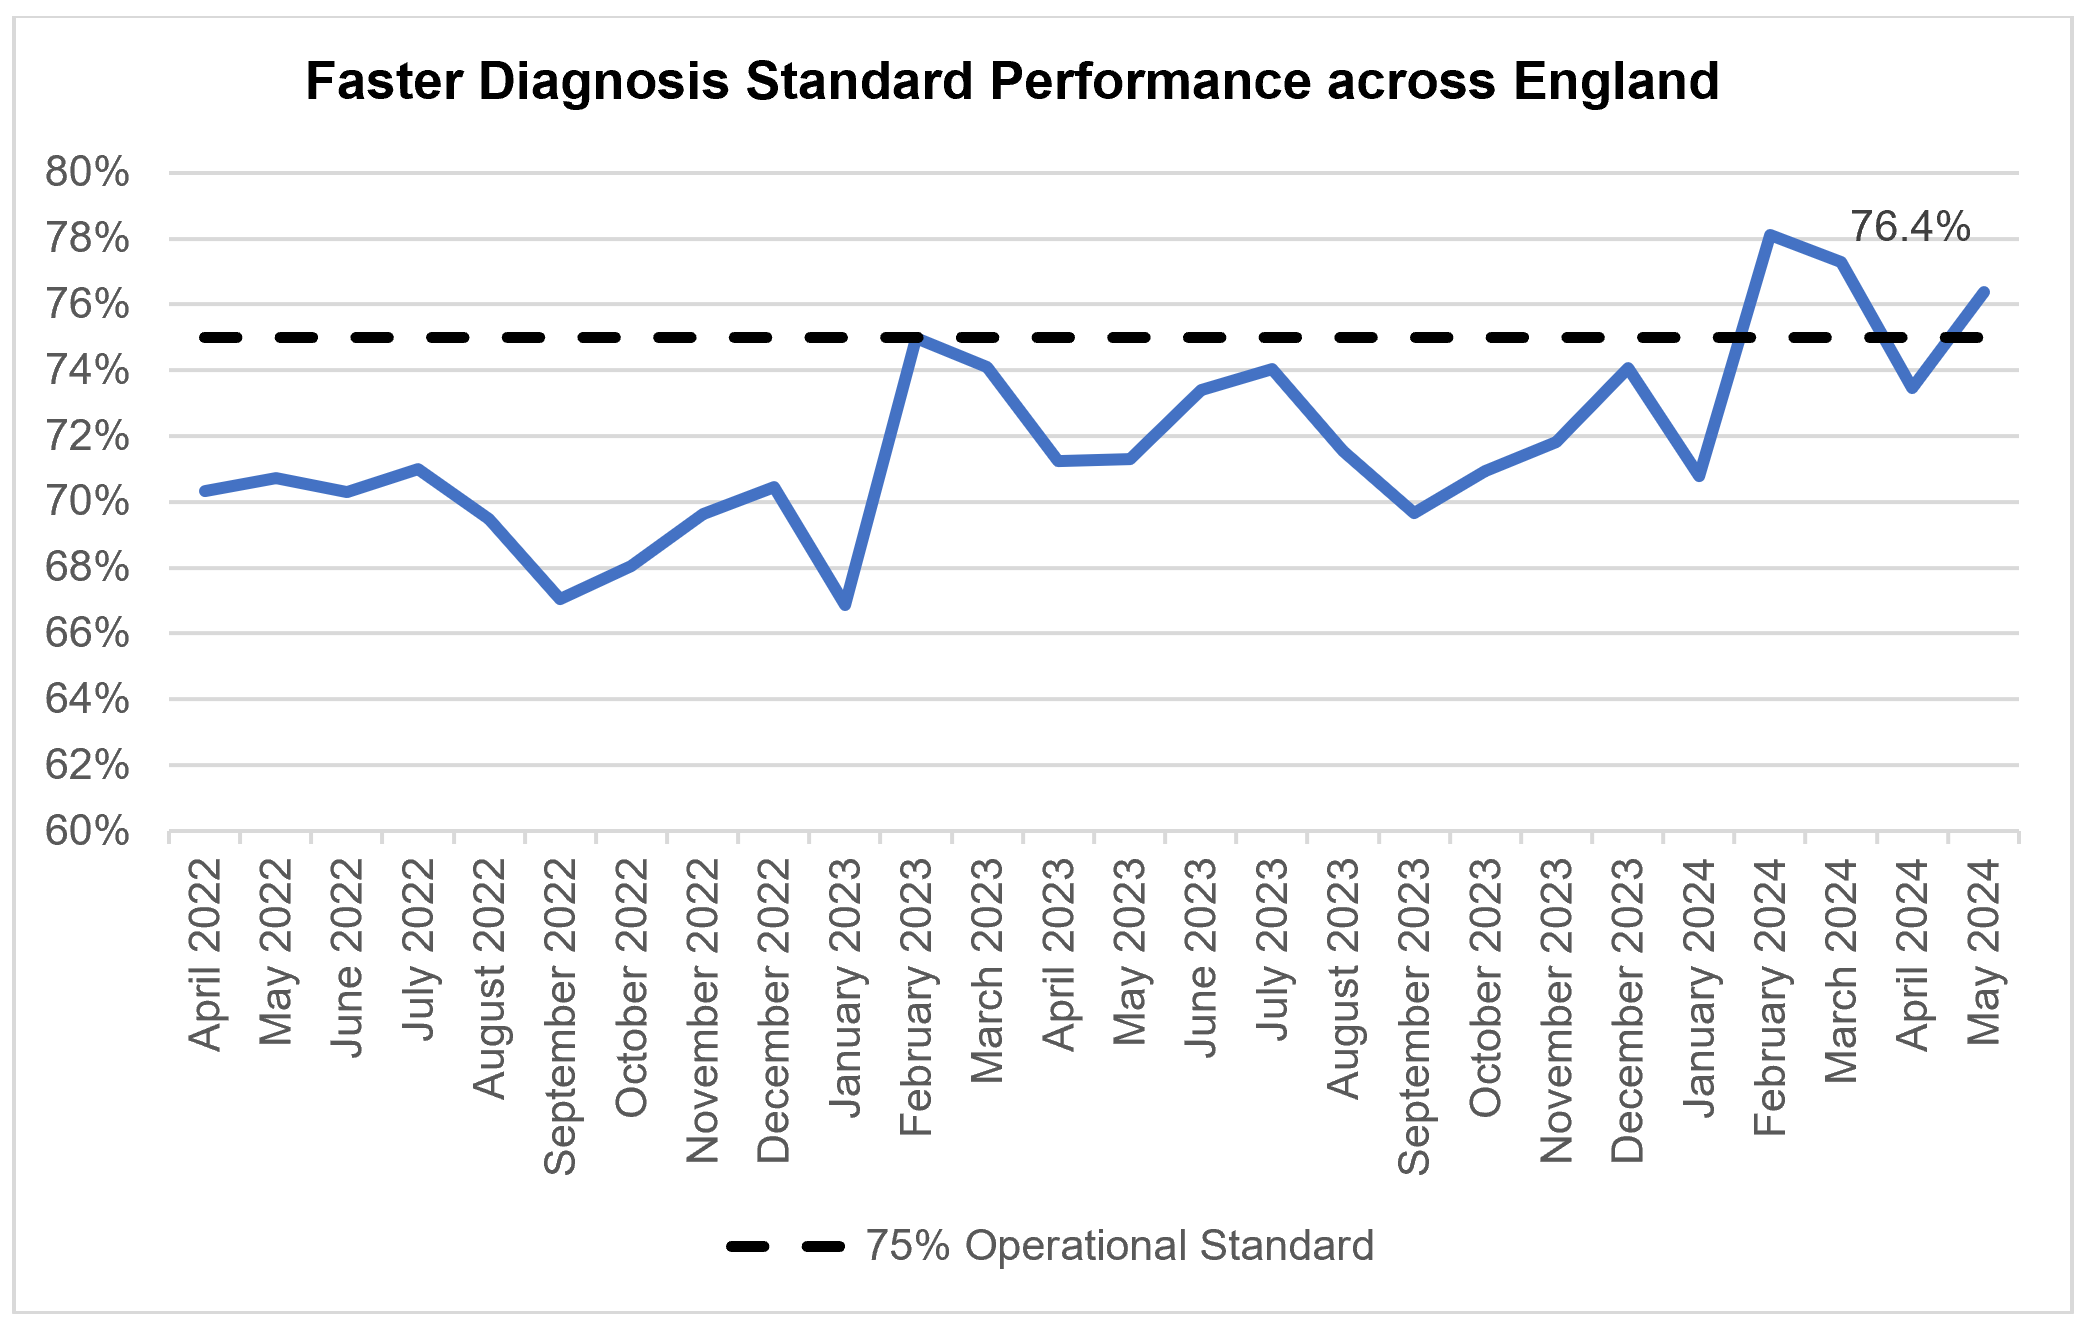
The NHS is working hard to keep up with this increase in demand. Performance against the Faster Diagnosis Standard in May was 76.4%, the third time in four months that the 75% standard was met (the NHS met the standard for first time ever in February). The NHS is now planning to raise this standard to 80% in two years.
Faster diagnosis standard performance across England
Following the return of the 62 day backlog to pre-pandemic levels in May the NHS has now shifted focus to the 62 day Urgent Referral to First Treatment standard. In May, performance against this was to 65.8%, which was 3.1% higher than at the same point last year, but still well below where we want to see it. The NHS has set the ambition to improve this to 70% to March 2025, as a first step in recovering performance to the 85% standard.
62 day urgent referral to first treatment performance
Mental health
Increasing visibility and reducing length of waits for Community Mental Health (CMH) Services is key to achieving parity for mental health. In November 2023, NHS England published interim contact-based data on longest waits for Adult CMH and CYP services (90th percentile and median waits).
As of April 2024, 10% of those still waiting for a second contact in Adult CMH services have been waiting at least 116 weeks (812 days). This has increased from 100 weeks (703 days) in December 2023. In Autumn 2024, NHS England will publish the full CMH metrics, which, as data quality improves, will begin to show the percentage of people receiving meaningful help within 4 weeks of referral in Adult CMH and CYP services. For everyone waiting for these services, timely access is key to meeting their needs effectively and improving experience and outcomes.