
Executive summary
This briefing draws on official statistics published here.
- 76.3% of patients attending A&E were admitted, transferred or discharged within four hours, which is below the NHS constitutional standard of 95%. This has increased from 75.2% in July 2024 and 73.0% in August 2023.
- The average ambulance response time for category 2 calls was 27 minutes and 25 seconds. This has improved from July 2024 and August 2023 and is below the 30 minute target for the year and above the NHS constitutional standard of 18 minutes.
- As of the end of July, on the total waiting list there were 62 million waits for procedures and appointments and an estimated 6.39 million people waiting for care.
- On the diagnostic waiting list at the end of July, there were 1.63 million waits, of which 364,544 had waited 6 weeks or more. The percentage of 6 week waits was 22.4%, down from 25.4% in July 2023.
- Levels of Urgent Suspected Cancer referrals have remained at high levels, with the 12,270 patients seen per working day in July 2024. This is 27% more referrals than the NHS was seeing before the pandemic
- In July, performance against the 62 day Urgent Referral to First Treatment Standard, was 67.7% which was 2.1% higher than at the same point last year, but still well below where we want to see it. The NHS has set the ambition to improve this to 70% to March 2025, as a first step in recovering performance to the 85% standard.
- The Mental Health Service Data Set performance data shows that 59,632 people were reported to have accessed a Specialist Community Perinatal Mental Health Service or a Maternal Mental Health Service in the 12 months from August 2023 to July 2024.
Urgent and emergency care
Demand fell for Urgent and emergency (UEC) care services in August.
The provisional figures published for August indicate that 8.6% of patients spent 12 hours from arrival in A&E. This is down from 9.1% last month.
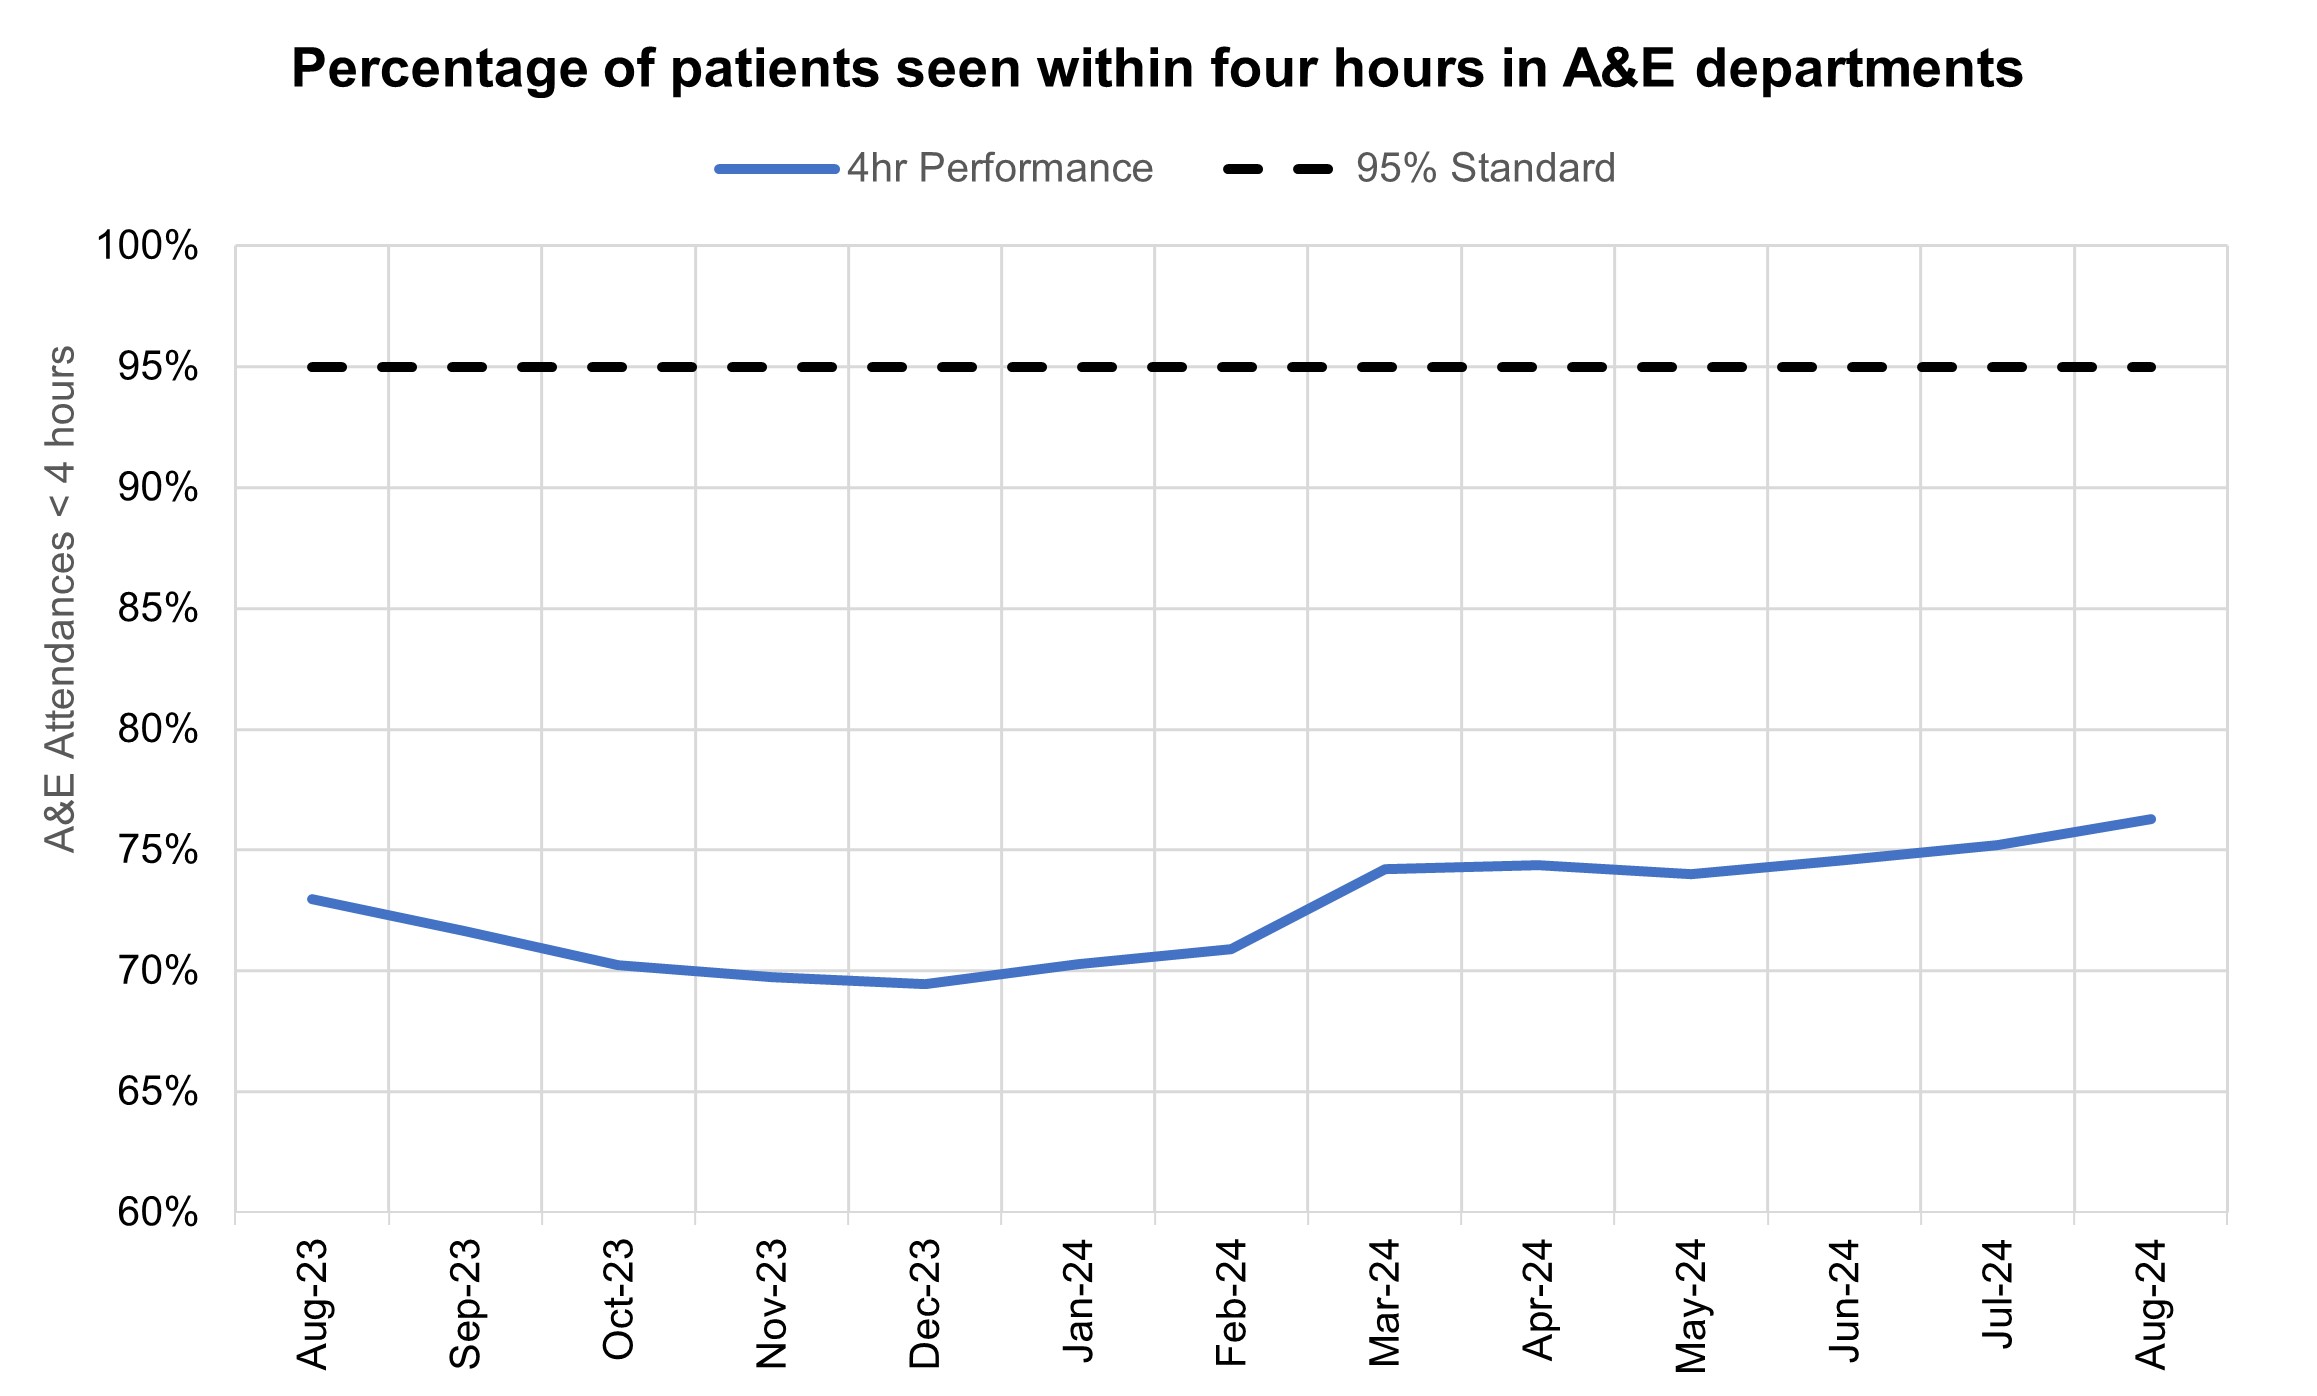
76.3% of patients attending A&E were admitted, transferred or discharged within four hours, which is below the NHS constitutional standard of 95%. This has increased from 75.2% in July 2024 and 73.0% in August 2023.
There was a total of 2,160,791 attendances at A&E departments across England in August. The average daily attendances decreased to 69,703, this is 6.9% lower than July’s daily average and 2.4% higher than August 2023.
Percentage of patients seen within four hours in A&E departments
Ambulance services answered 754,495 calls to 999, or 24,339 per day, a decrease of 2% compared to August 2023 and 8% less than July 2024. There were 371,492 incidents where a patient was conveyed to A&E, 1% more than in August 2023.
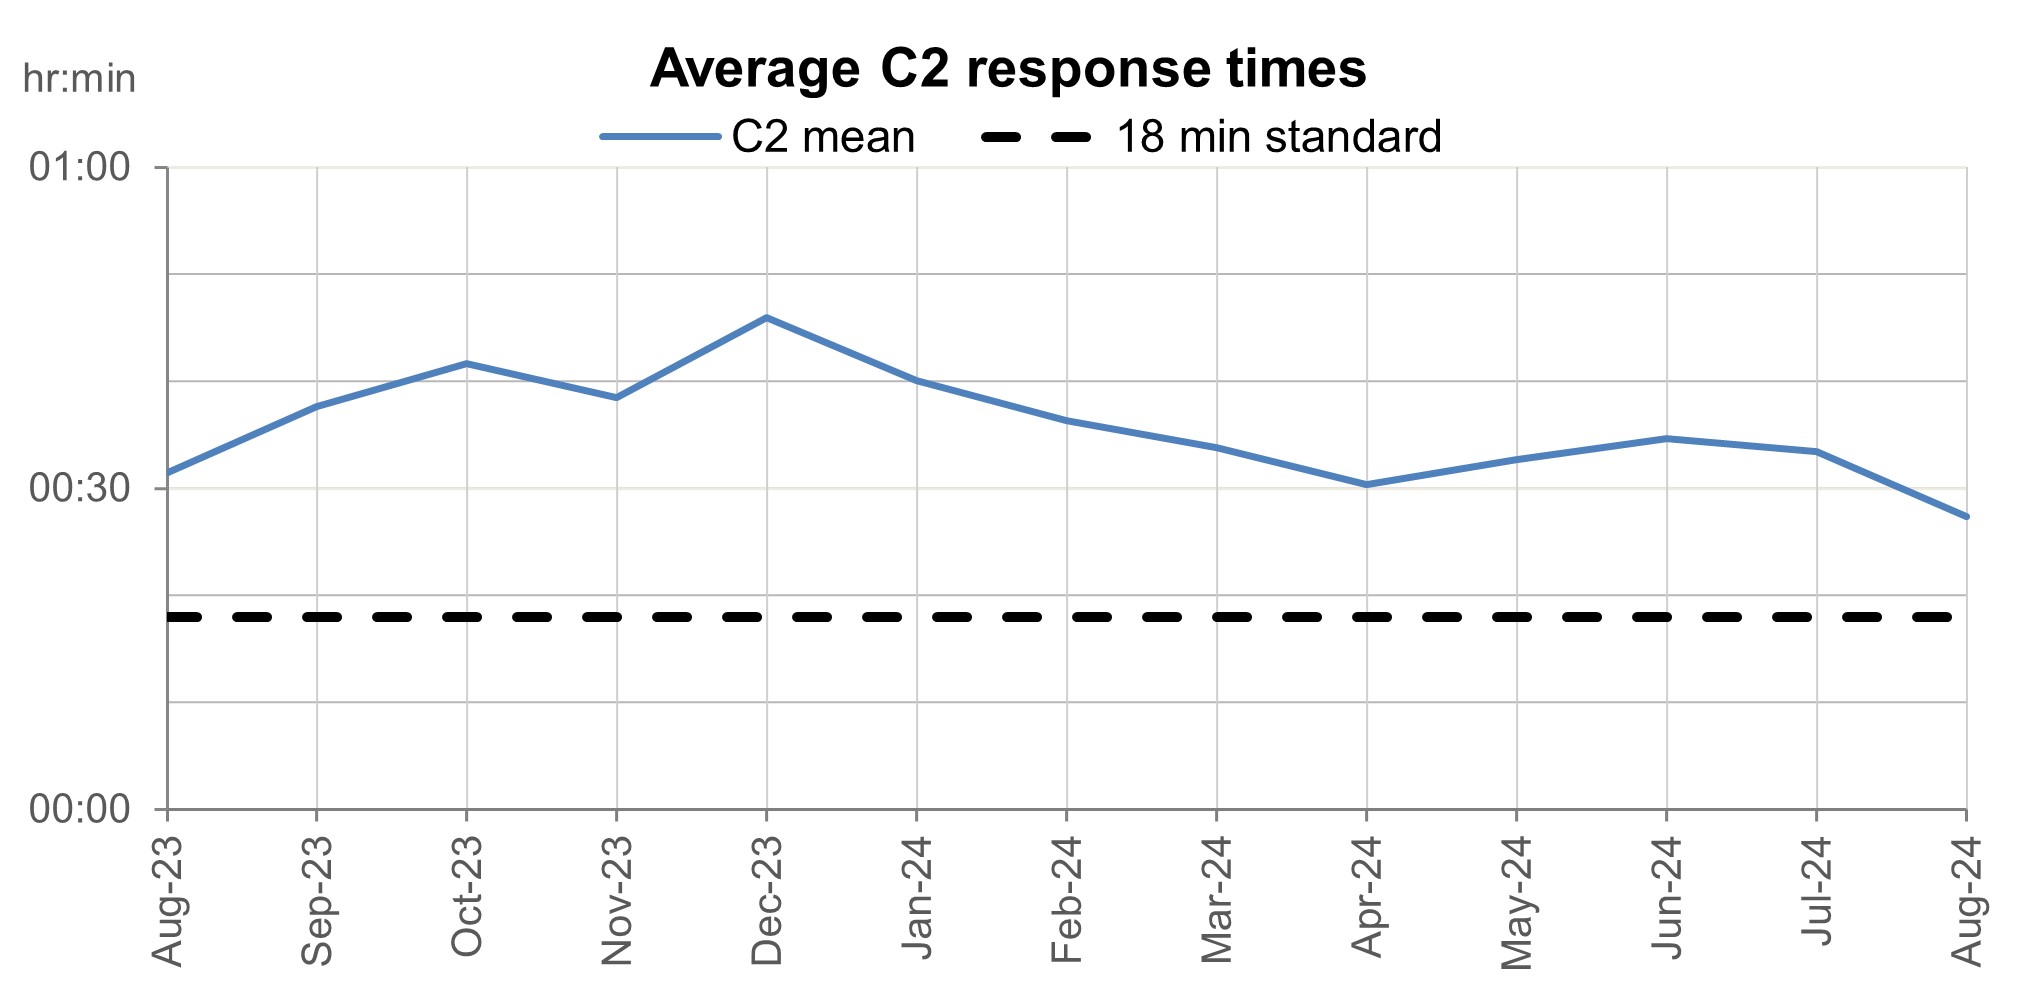
The average ambulance response time for category 2 calls was 27 minutes and 25 seconds. This has improved from July 2024 and August 2023 and is below the 30 minute target for the year and above the NHS constitutional standard of 18 minutes.
NHS England are continuing to publish average C2 response times by ICB each month, updating the spreadsheet with data for 2024/25 so far that they published for the first time in August 2024.
Average category 2 response times
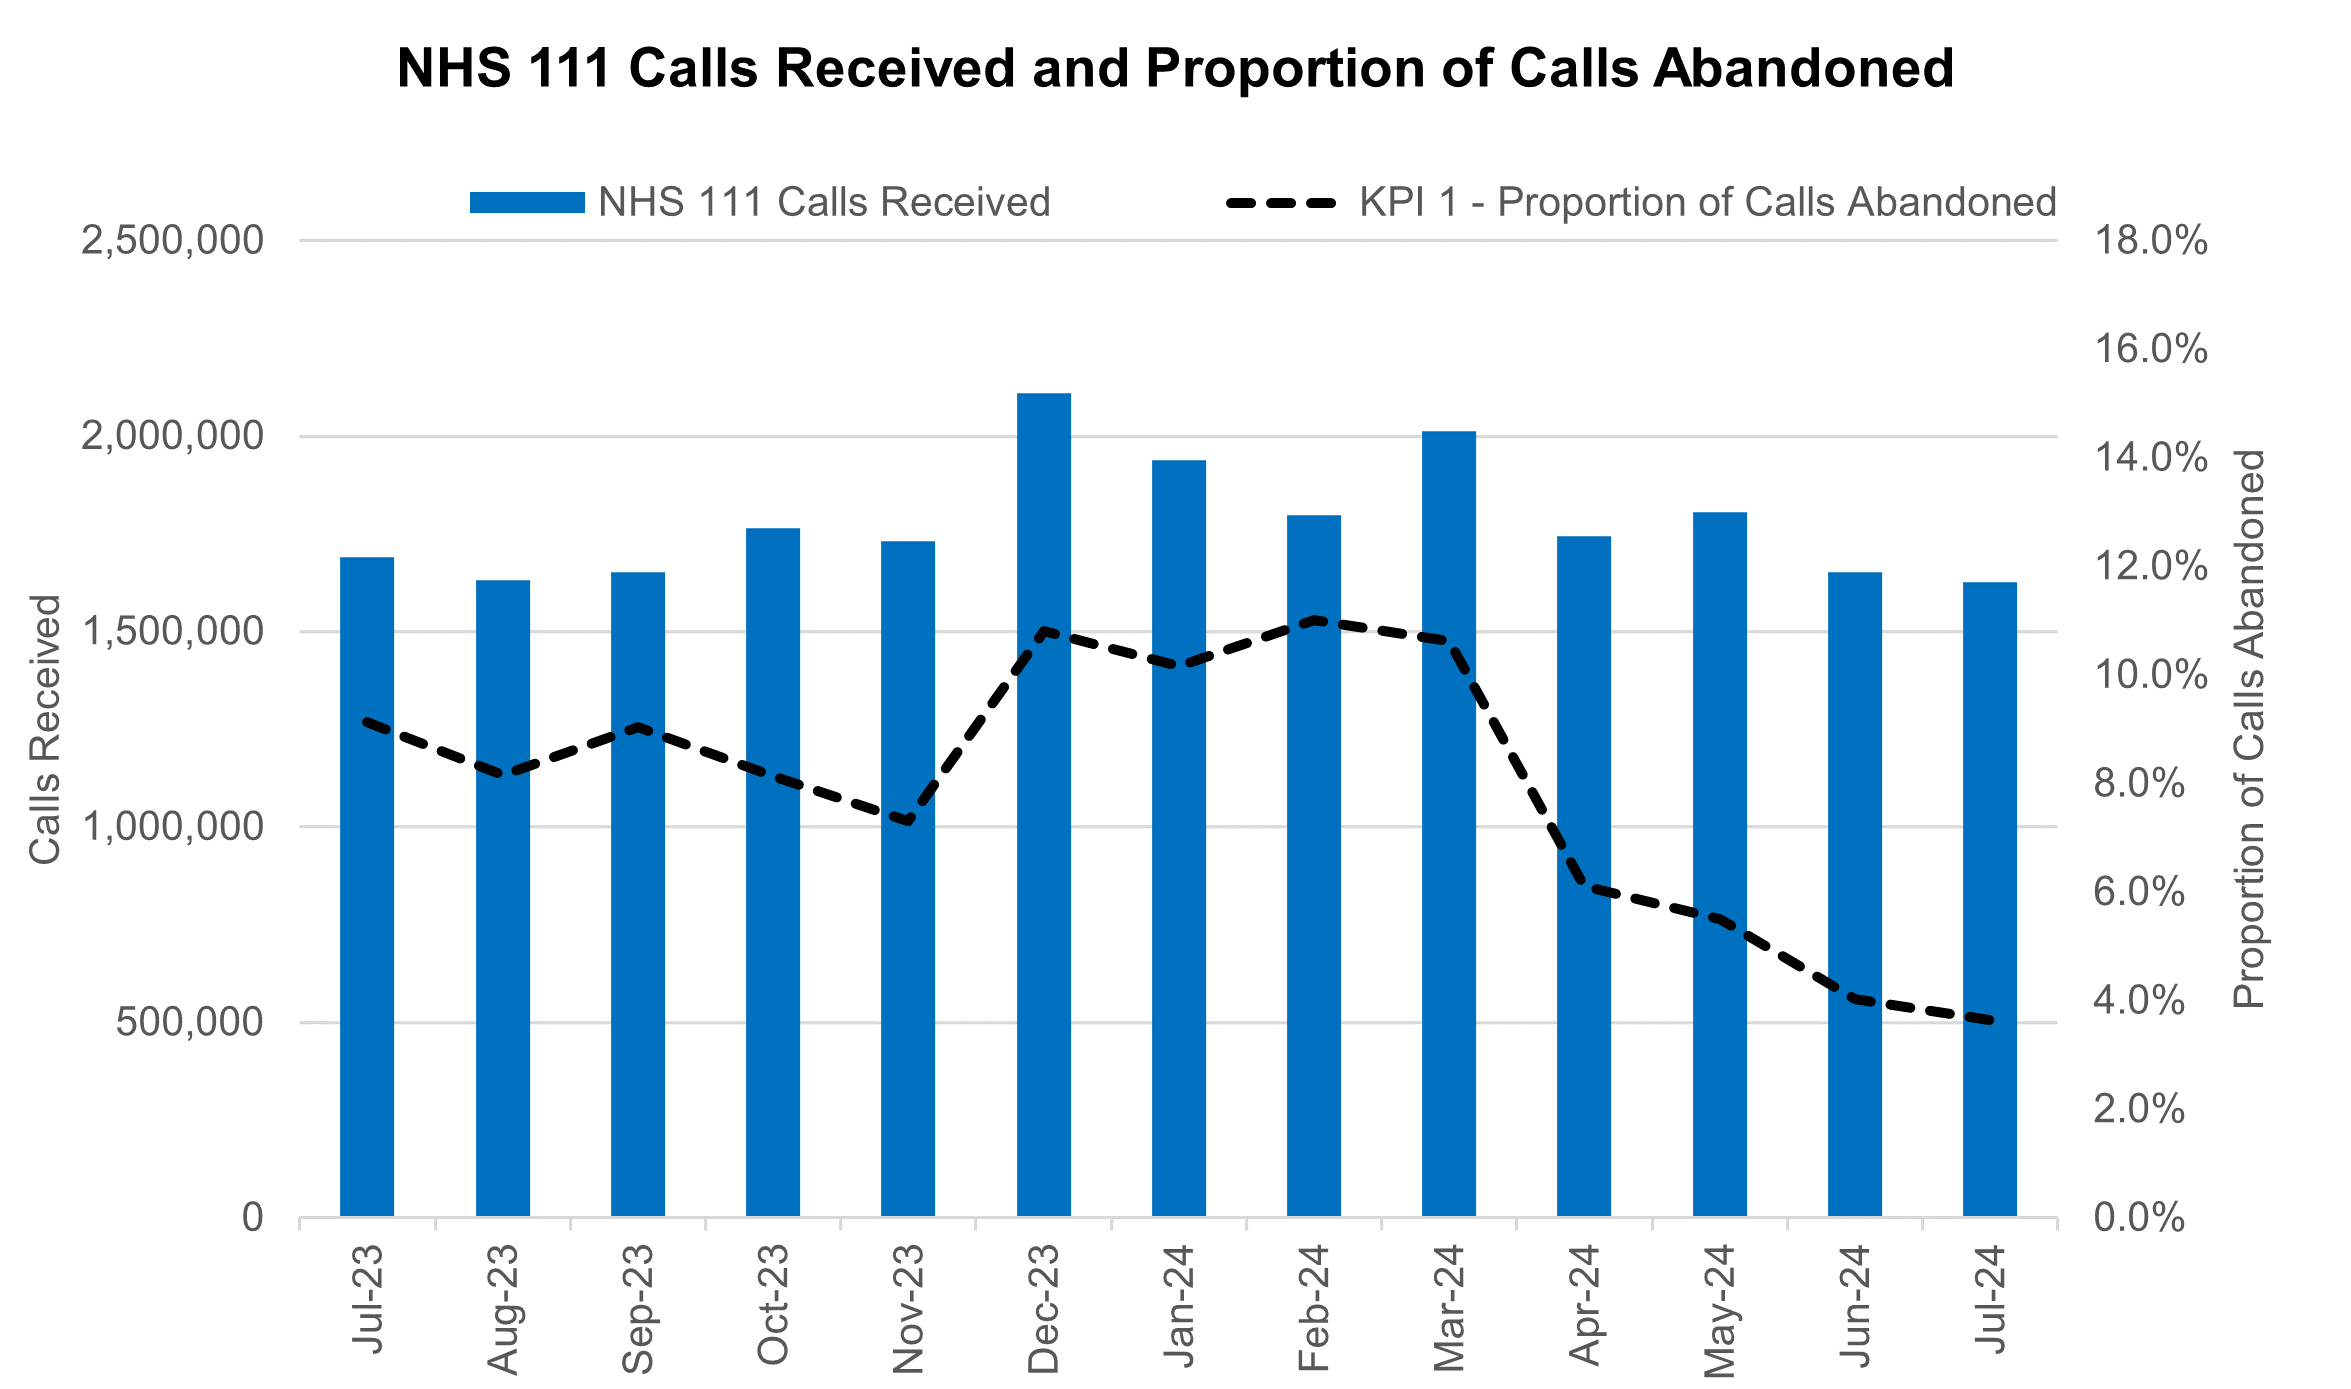
NHS 111 received 1.6 million calls (c. 52.5 thousand per day) in July 2024. Demand was 1.4% down year on year and 3.8% below volumes received in June 2024.
The proportion of calls abandoned dropped 0.4% percentage points from the previous month (now at 3.6%) and the average speed to answer reduced by 5 seconds to 60.
NHS 111 calls received and proportion of calls abandoned
There has been a change in how the data is collected for the acute discharge sitrep. This is the third month of using the new data collection system and not all organisations have been able to submit, there will be a decrease in the data volumes for bed numbers.
Elective recovery
As of the end of July, on the total waiting list there were 7.62 million waits for procedures and appointments and an estimated 6.39 million people waiting for care. The NHS constitution standard states that patients have a right to start consultant-led treatment within a maximum of 18 weeks from referral for non-urgent conditions.
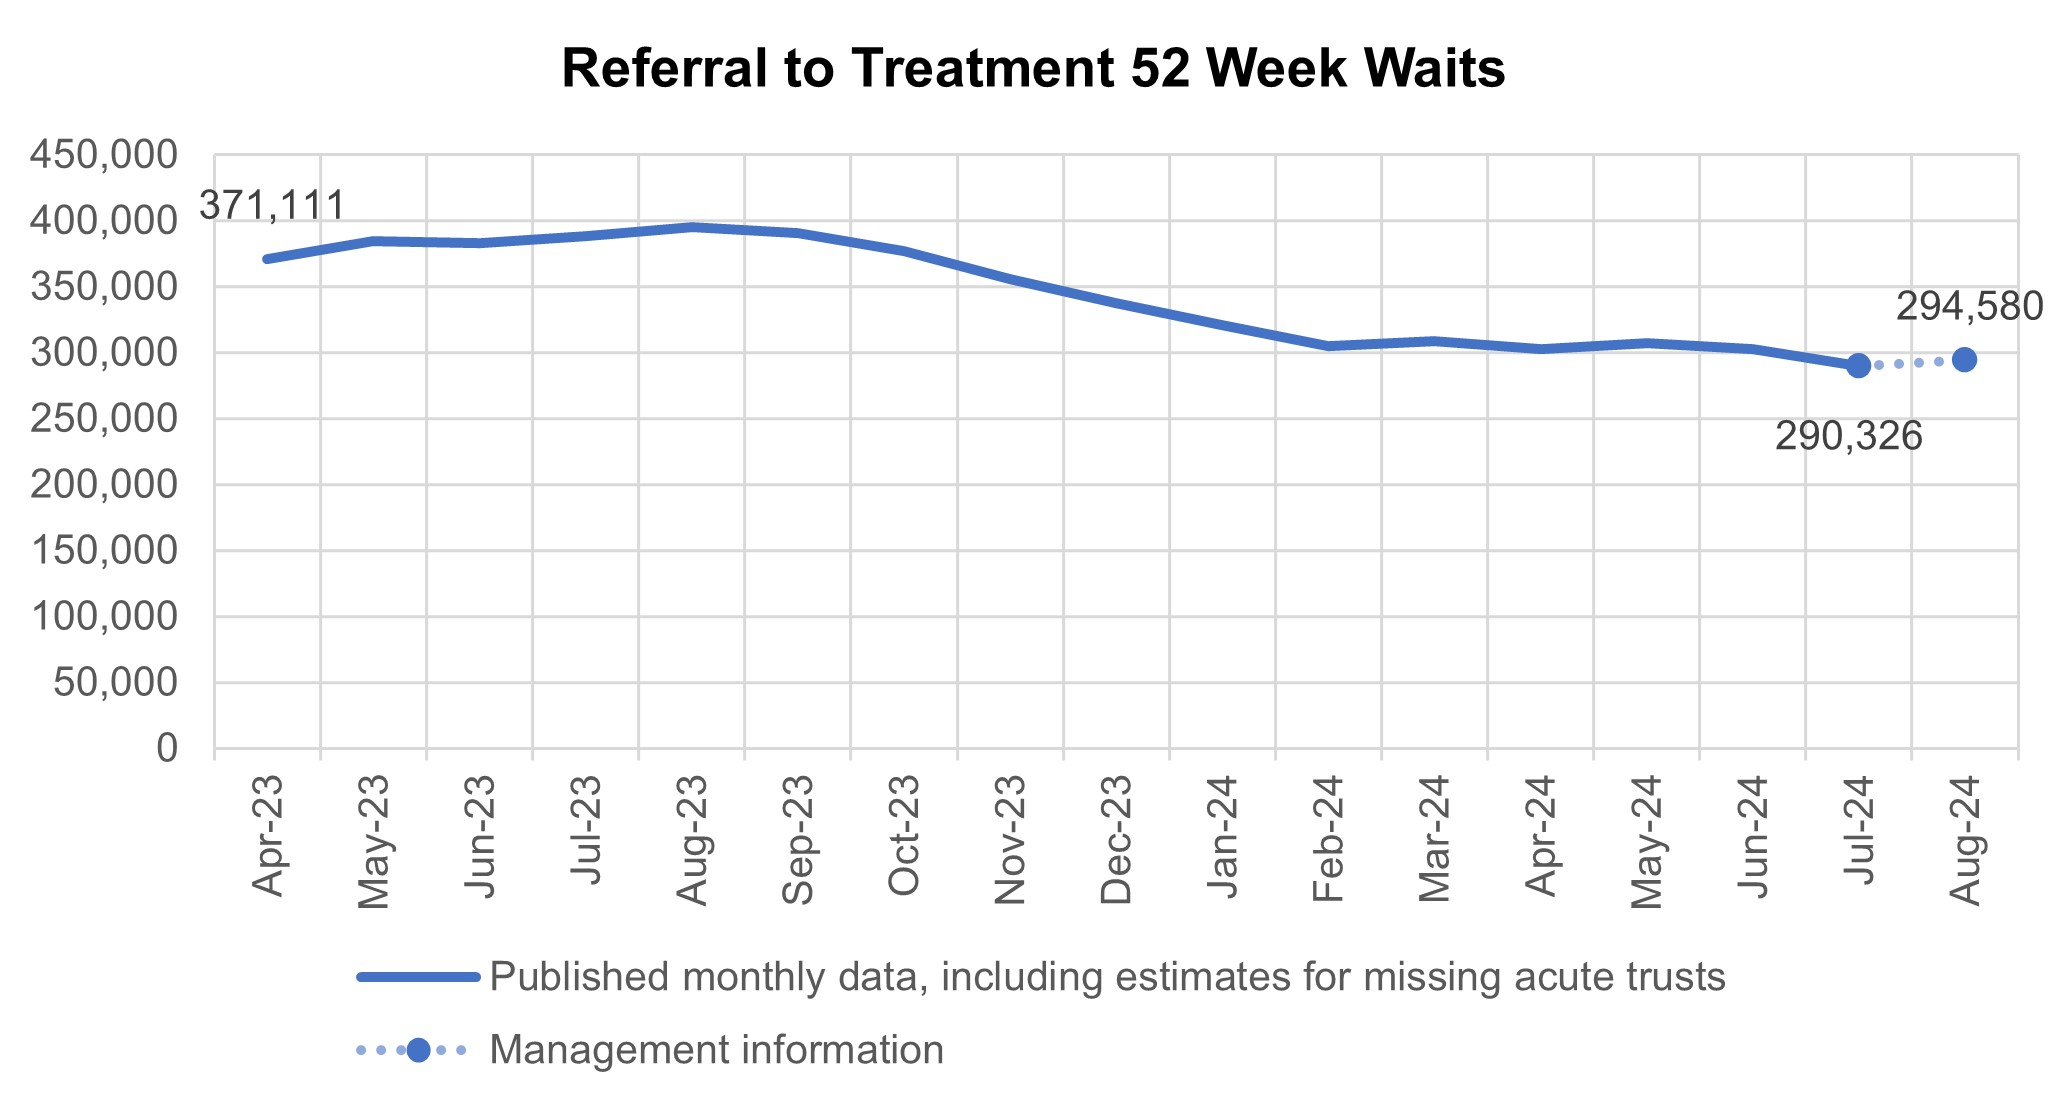
290,326 patients had been waiting more than 52 weeks at the end of July, compared to 388,505 at the end of July 23. Additional management data* suggests that 294,580 patients were waiting more than 52 weeks as of the end of August.
*Management information for the latest month is taken from the Waiting List Minimum Dataset (WLMDS) Figures include data up to week ending 25 Aug 24. WLMDS data is subject to less validation than the published monthly figures and does not include estimates for missing providers. (134 out of 135 acute trusts submitted data for week ending 25 Aug 24).
Referral to treatment 52 week waits
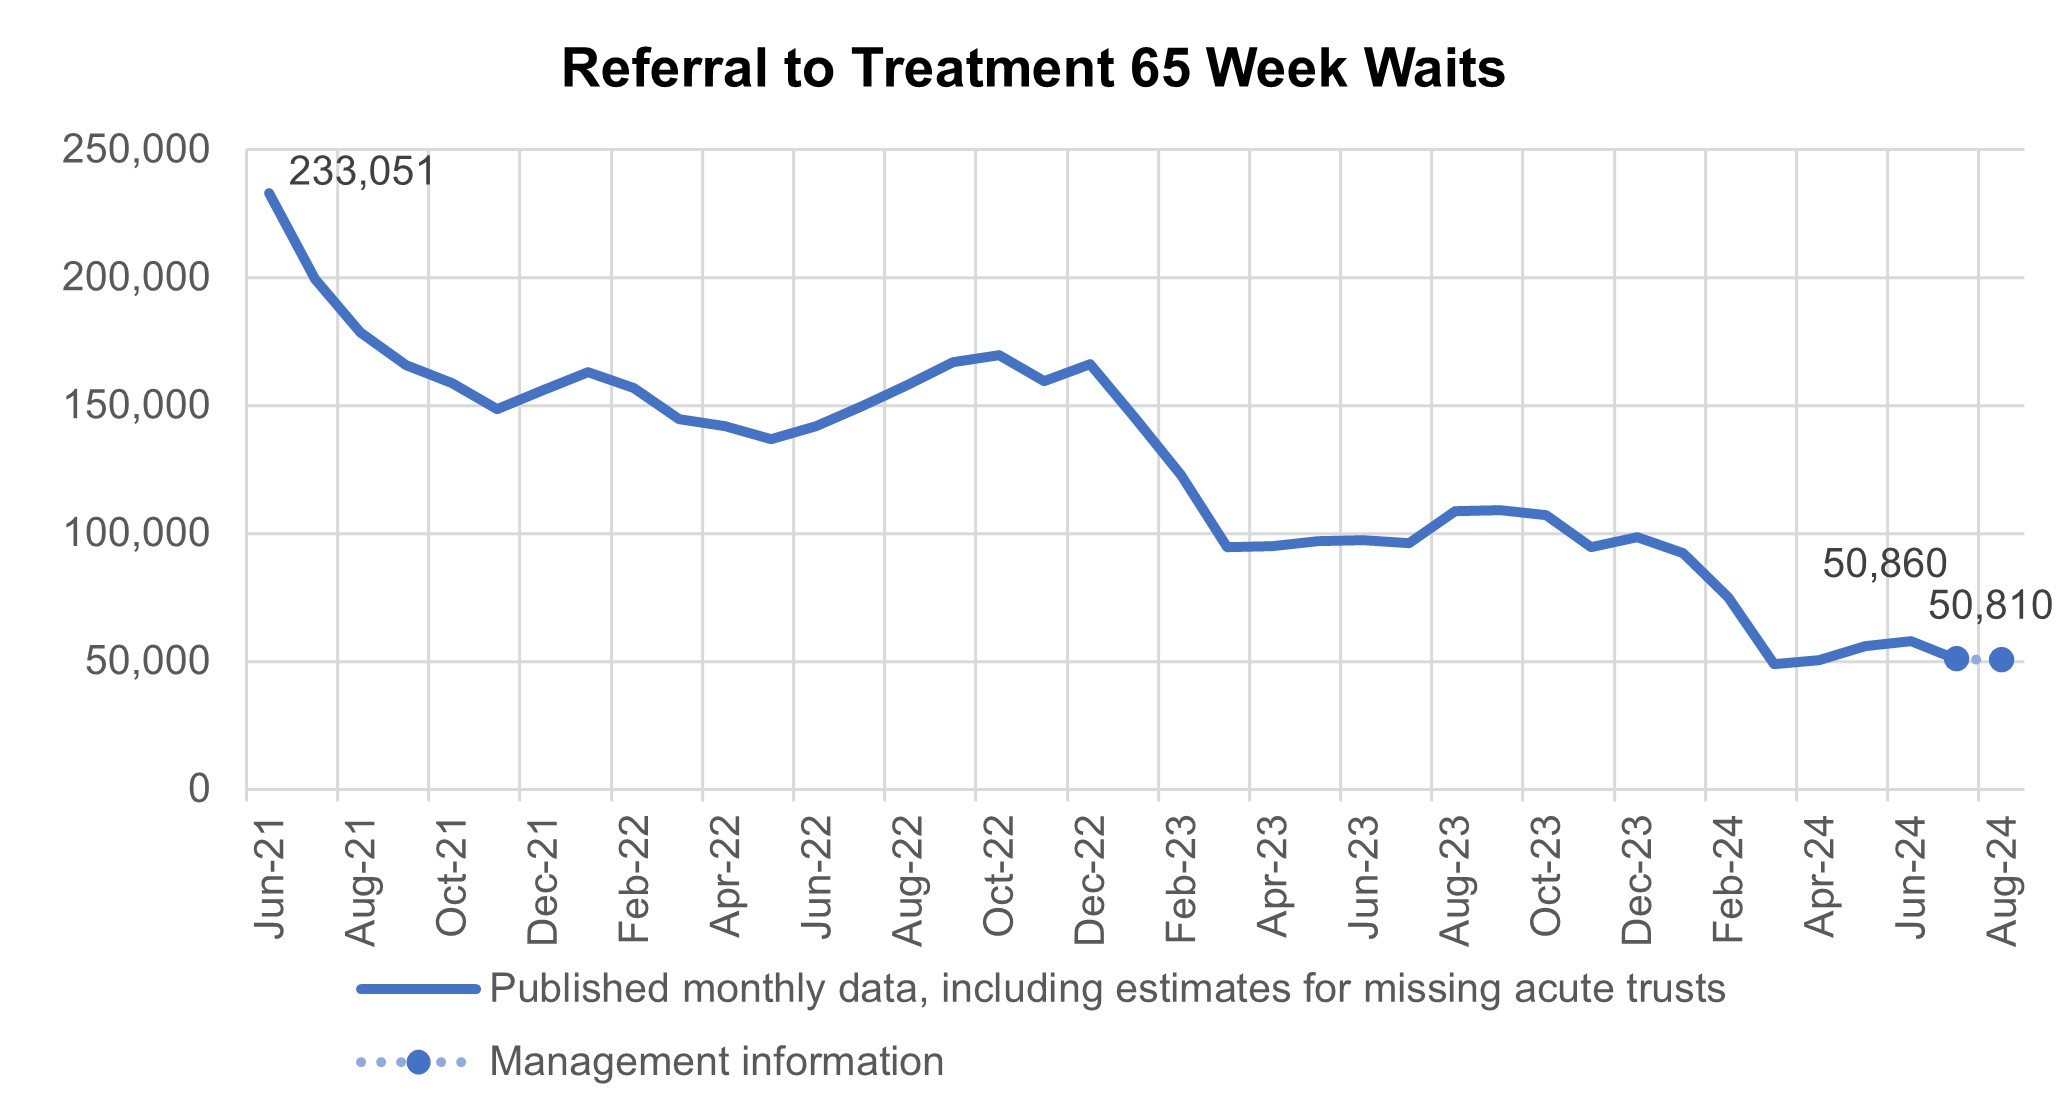
The number of patients waiting more than 65 weeks for treatment was 50,860 at the end of July, compared to 96,023 at the end of July 2023. Additional management data suggests this number has decreased slightly to 50,810 patients waiting more than 65 weeks for treatment as of the end of August.
Referral to treatment 65 week waits
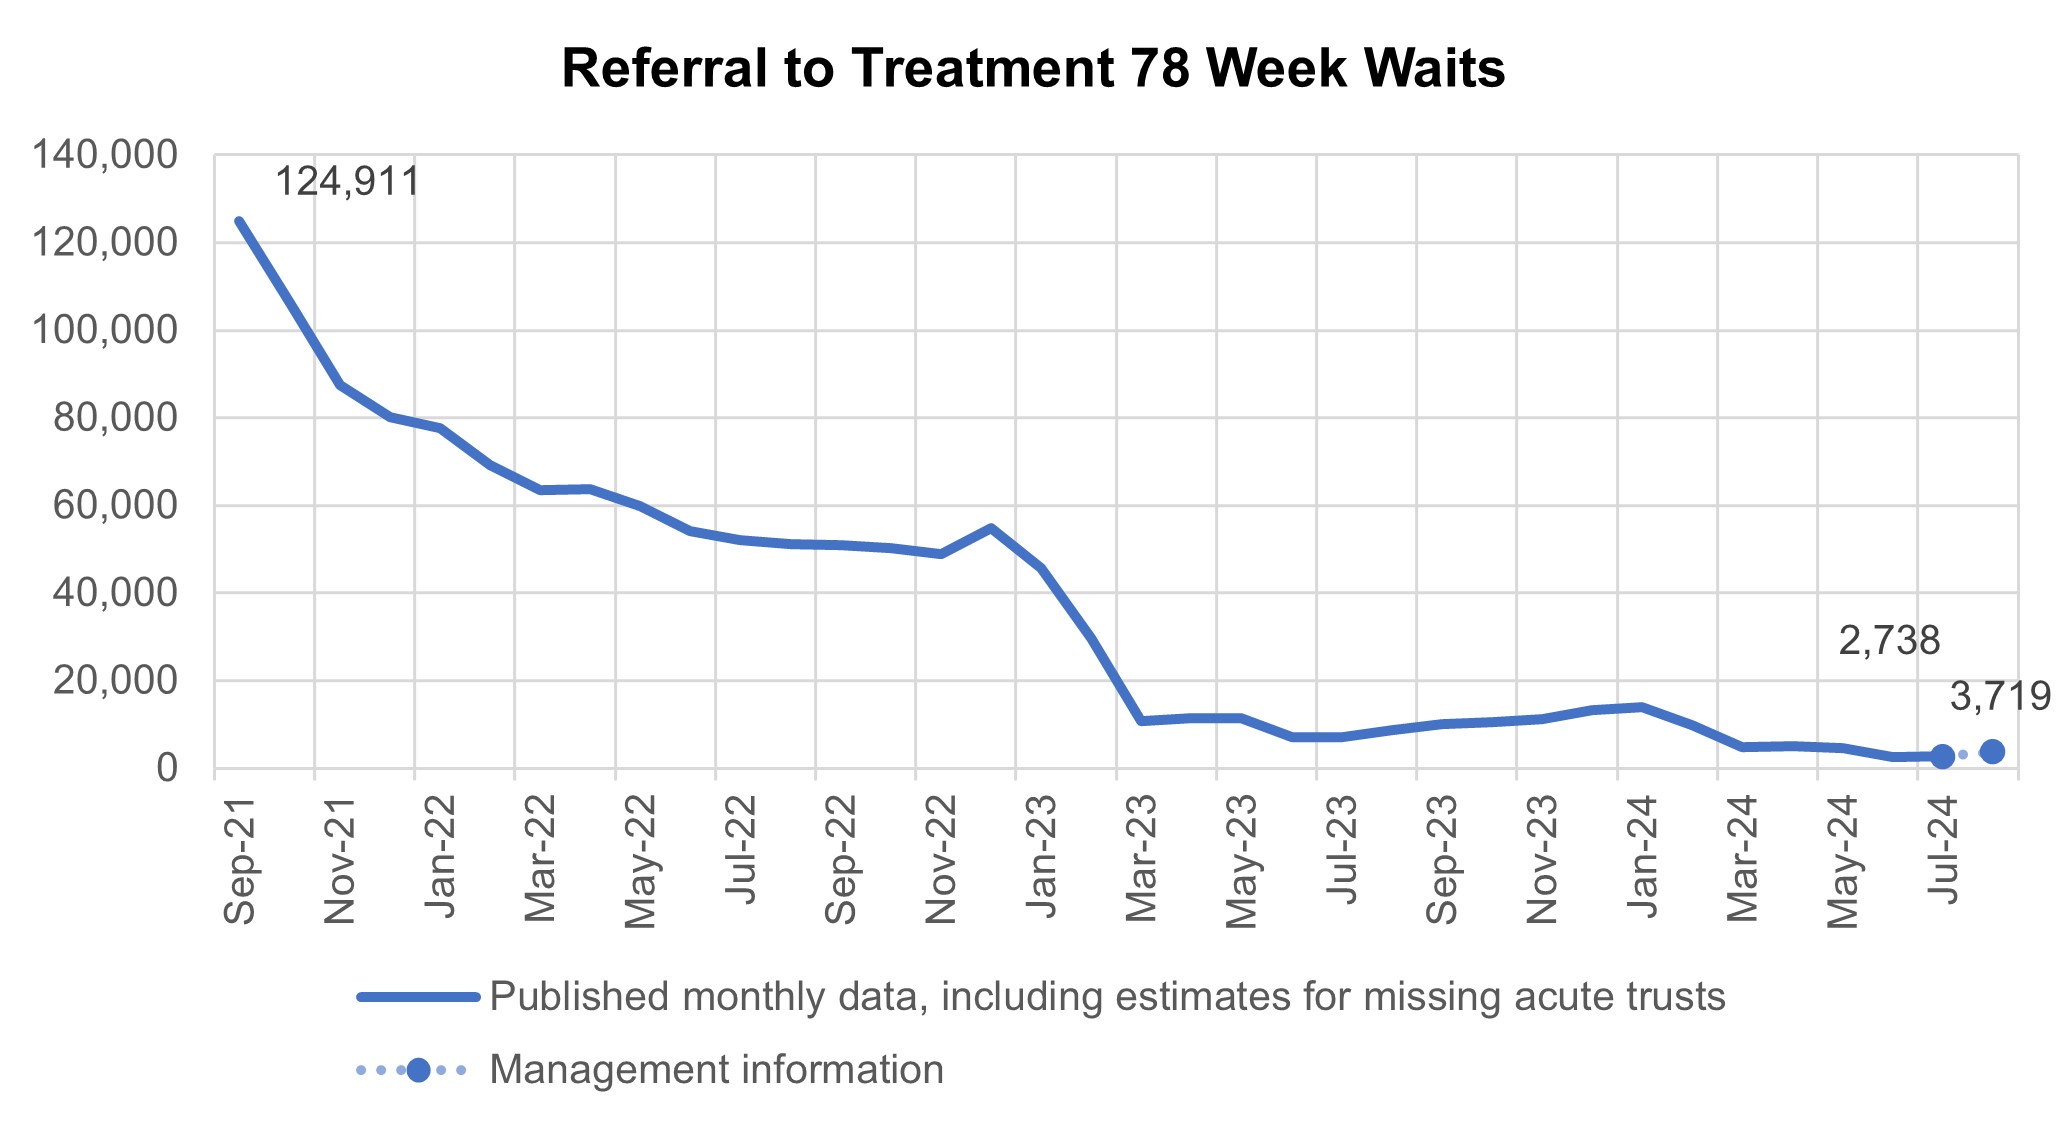
There has been a reduction in the longest waits for care, 2,738 patients were waiting more than 78 weeks for treatment at the end of July, compared to 7,079 at the end of July 23 (down 61.3%). Additional management data suggests 3,719 patients were waiting more than 78 weeks for treatment as of the end of August.
Referral to treatment 78 week waits
Patients are still experiencing waiting times of more than 104 weeks for treatment with 107 patients waiting for treatment at the end of July, compared to 263 at the end of July 23. Additional management data suggests this number decreased between July and August, with 88 patients waiting more than 104 weeks for treatment at the end of August.
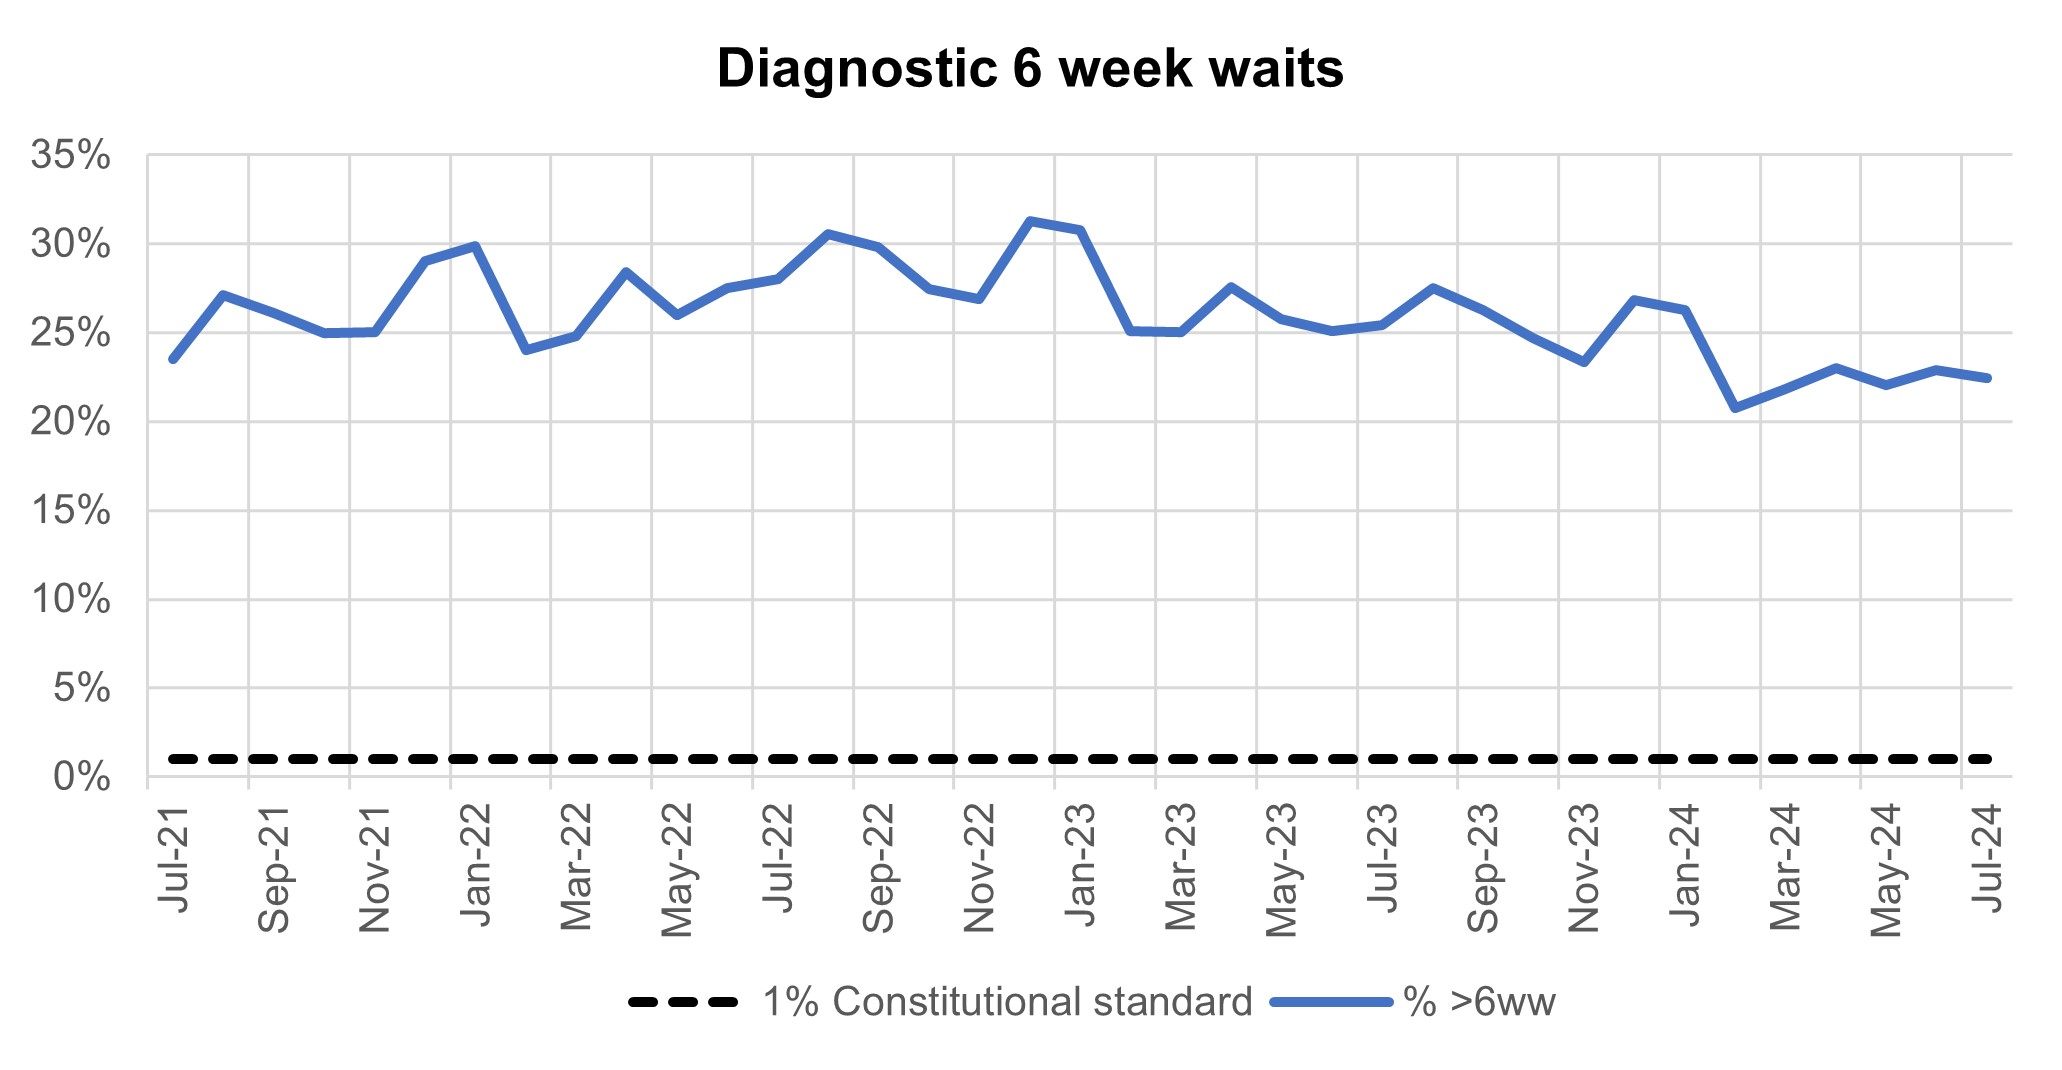
At the end of July, on the diagnostic waiting list there were 1.63 million waits, of which 364,544 had waited 6 weeks or more. The percentage of 6 week waits was 22.4%, down from 25.4% in July 2023. Progress is being made towards the interim recovery target of not more than 5% of the waiting list over 6 weeks and an increased percentage of diagnostic activity is supplied by Community Diagnostic Centres.
Diagnostic 6 week waits
Cancer
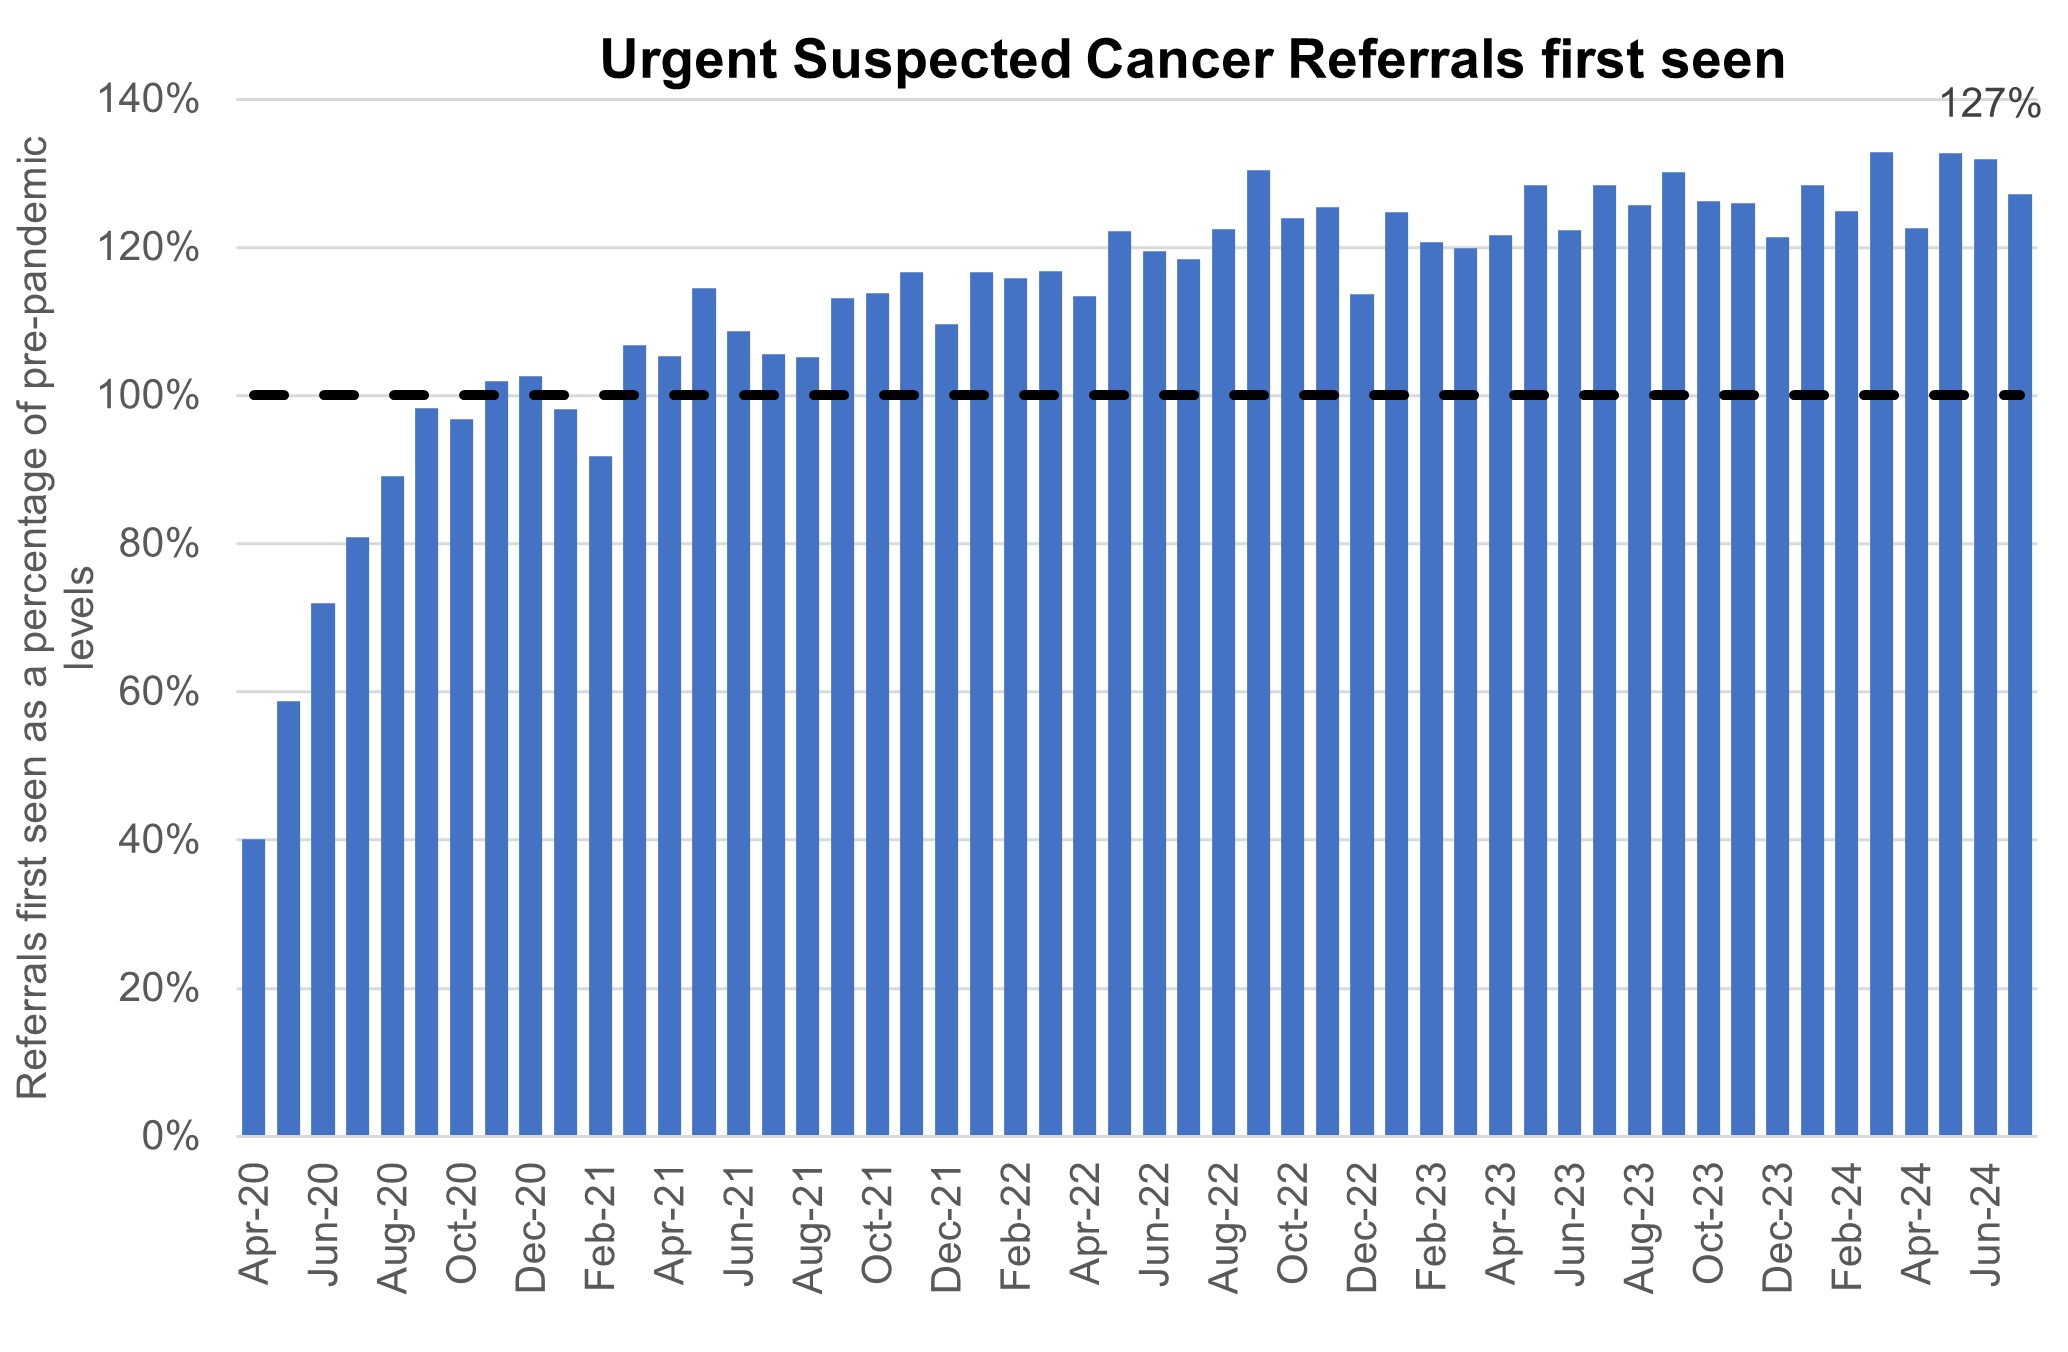
Levels of Urgent Suspected Cancer referrals have remained at high levels, with the 12,270 patients seen per working day in July 2024. This is 27% more referrals than the NHS was seeing before the pandemic – the equivalent of 3,000 more patients per working day.
Treatment activity was also at a record high level with over 1,400 patients starting cancer treatment per working day, 15% above pre-pandemic levels.
Urgent suspected cancer referrals first seen
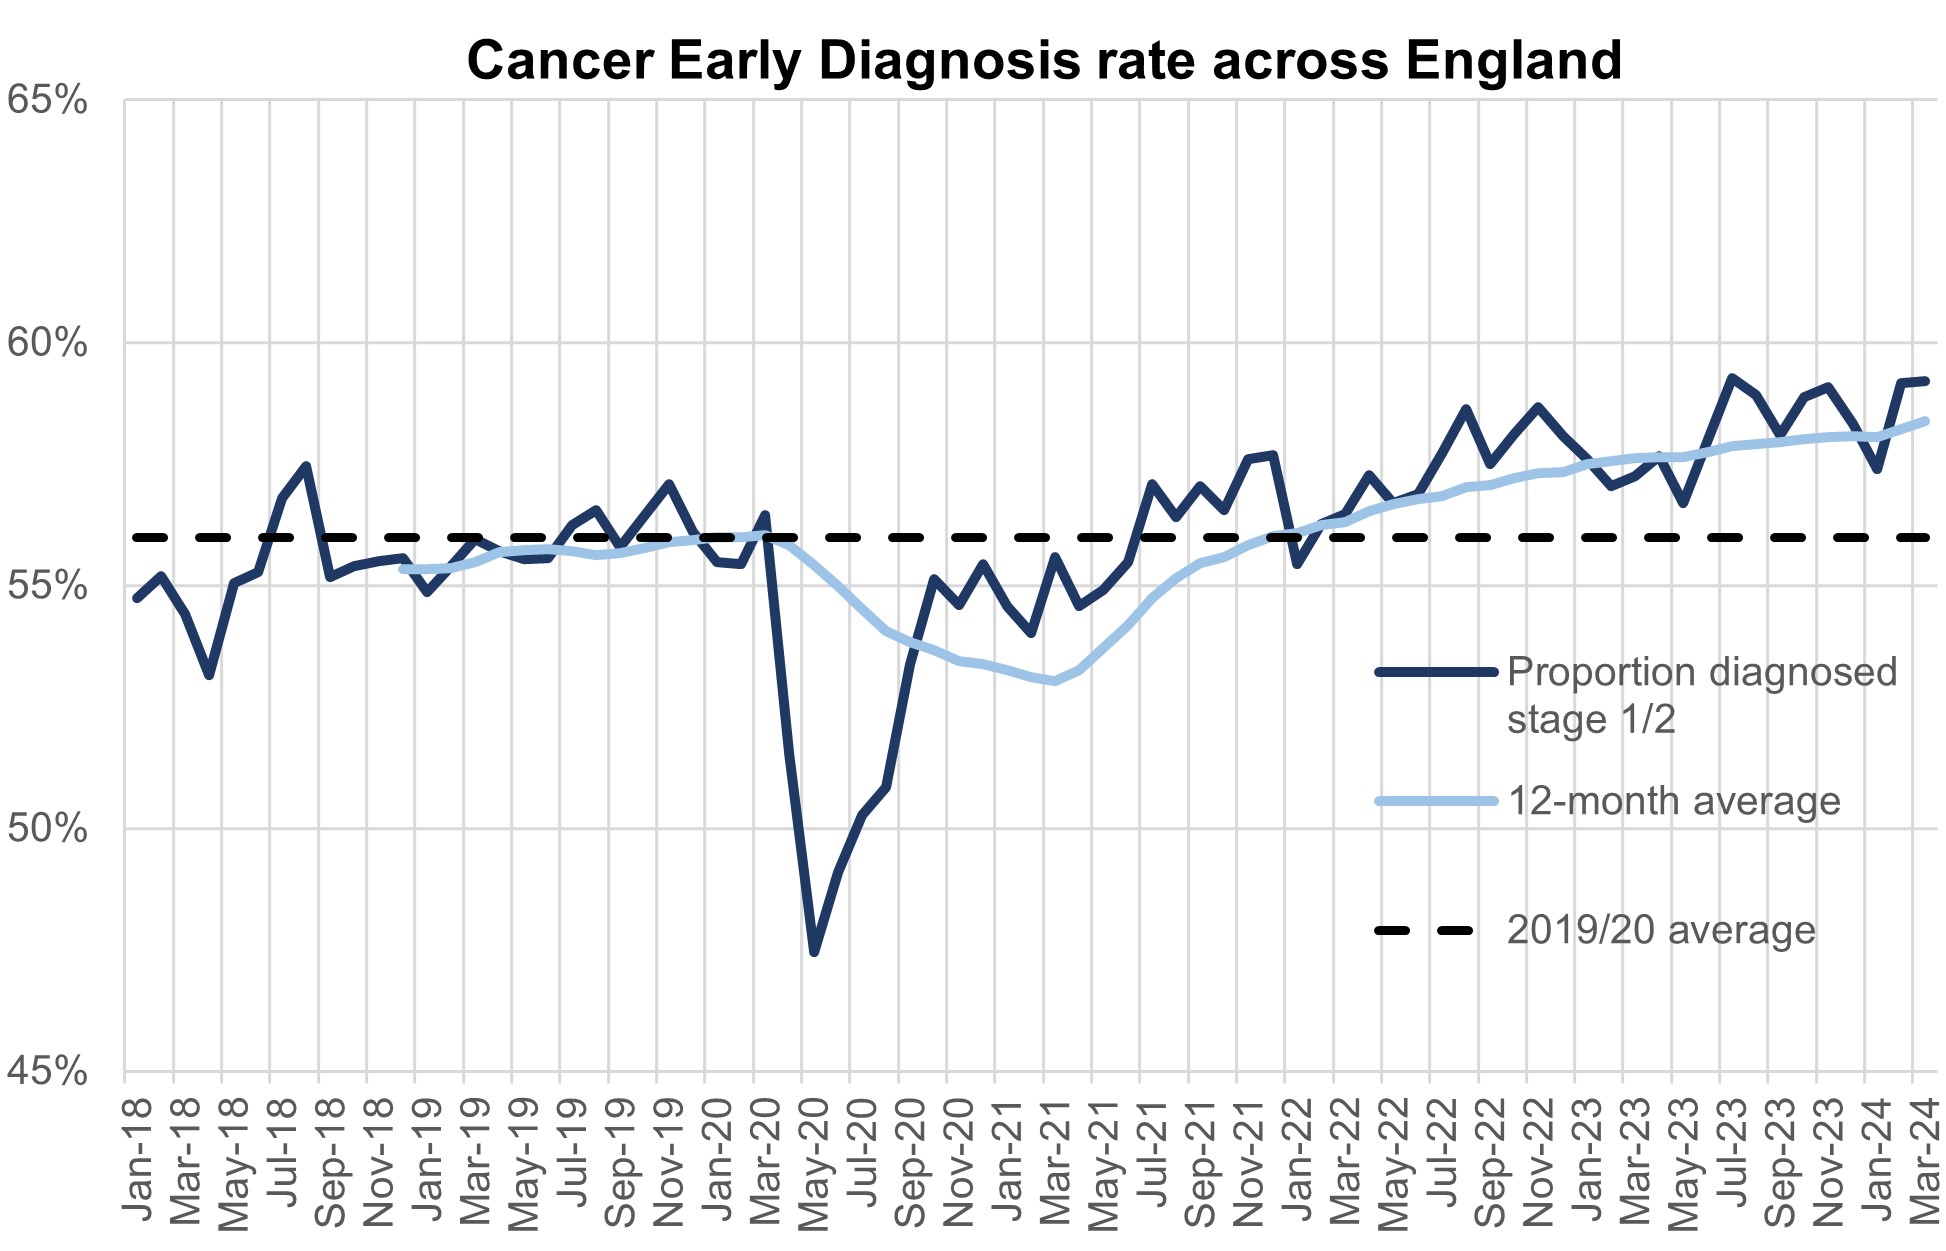
The increase in referrals has also contributed to increases in early diagnosis, which are now about 2 percentage points higher than before the pandemic. Cancer survival also continues to improve. In 2023, the Annals of Oncology published findings showing that cancer deaths are around 10% lower in the UK compared to five years ago.
Cancer early diagnosis rate across England
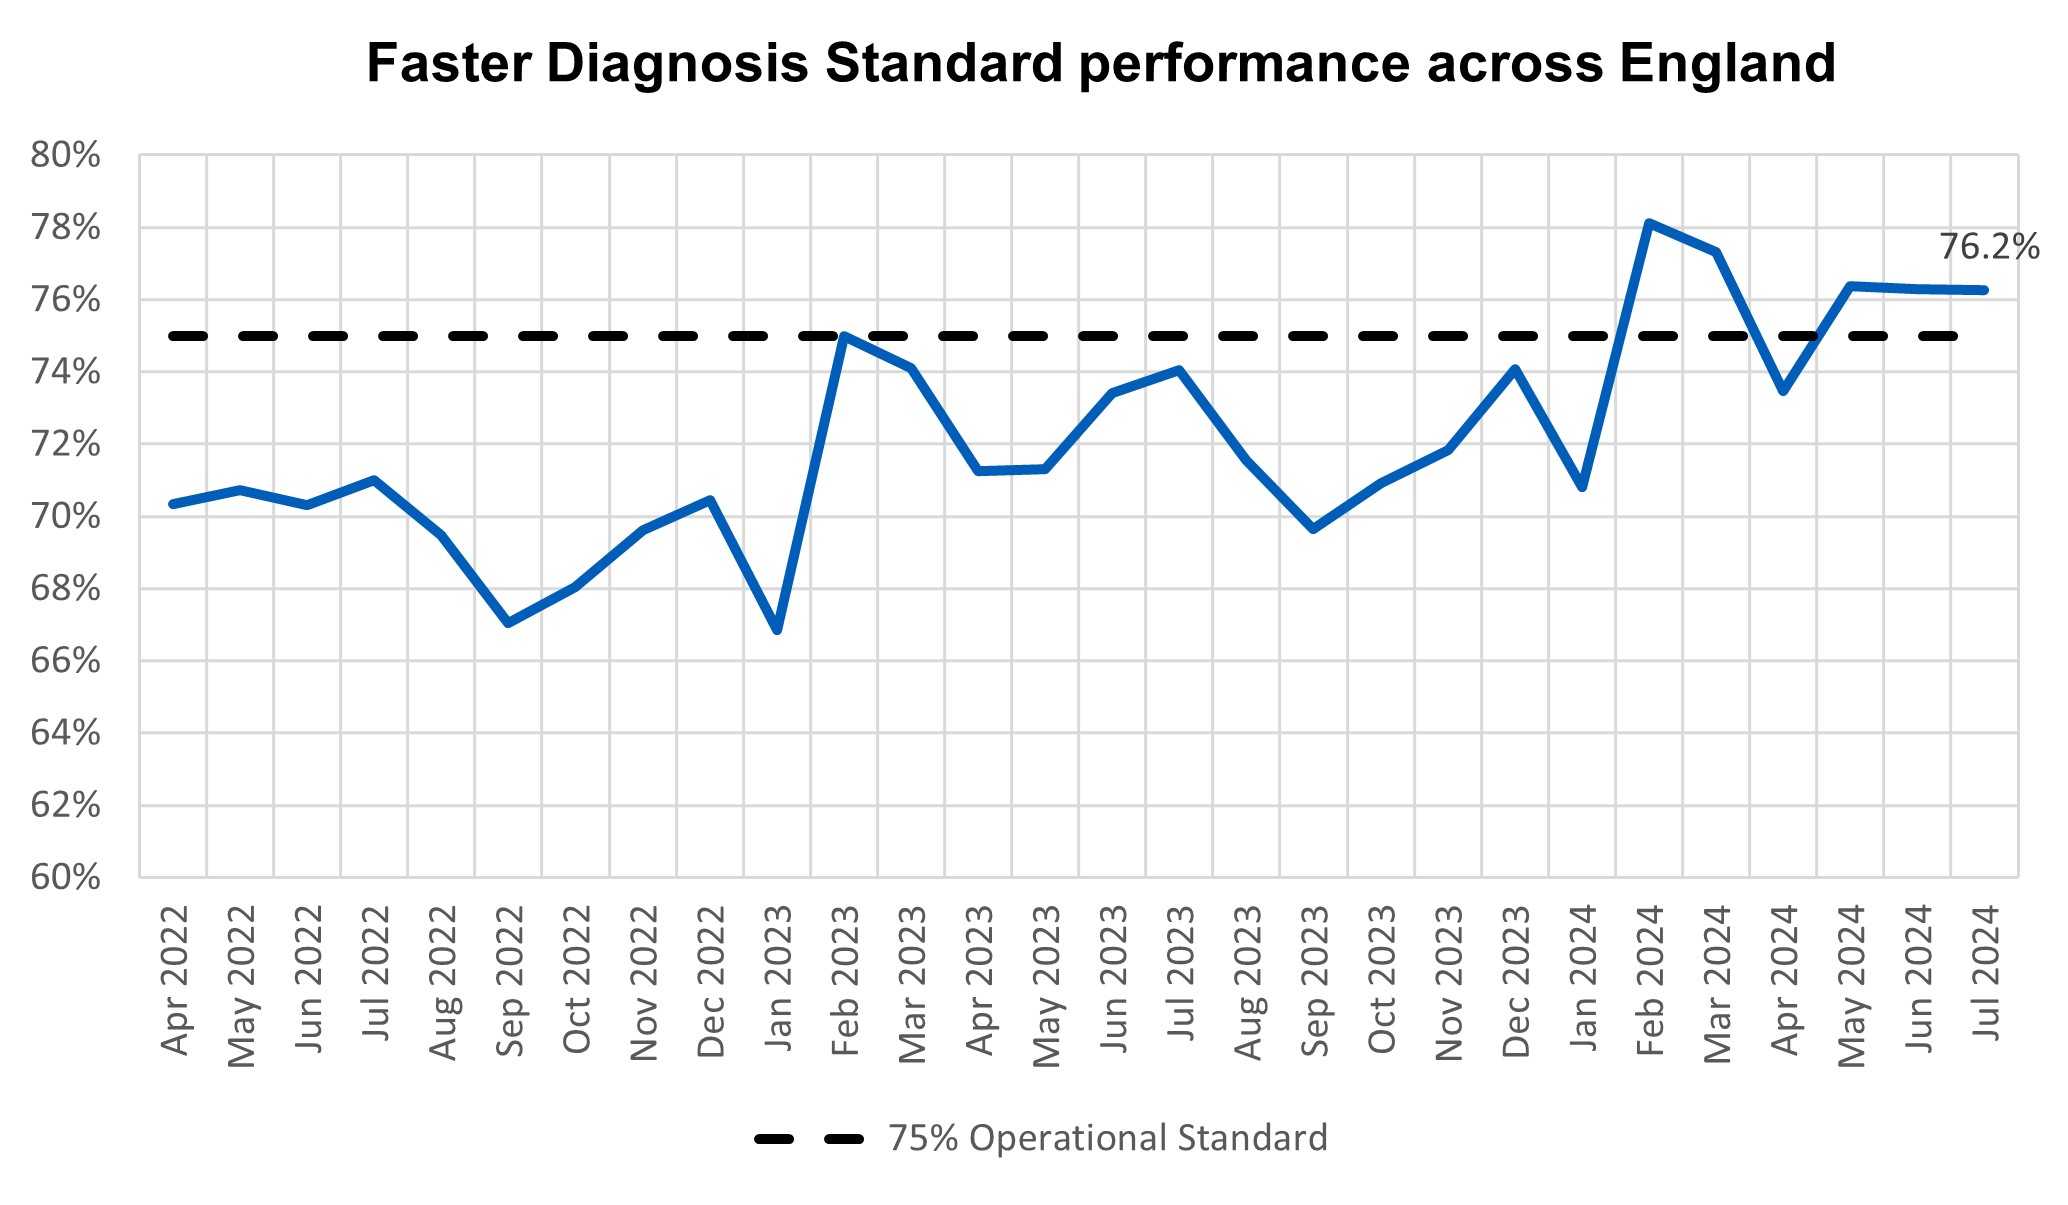
The NHS is working hard to keep up with this increase in demand. It has been accelerating the installation of new diagnostic capacity, much of it in Community Diagnostic Centres. Performance against the Faster Diagnosis Standard in July was 76.2%, the fifth time in six months that the 75% standard was met (the NHS met the standard for first time ever in February this year). The NHS has announced that this standard will increase to 80% by March 2026.
Faster diagnosis standard performance across England
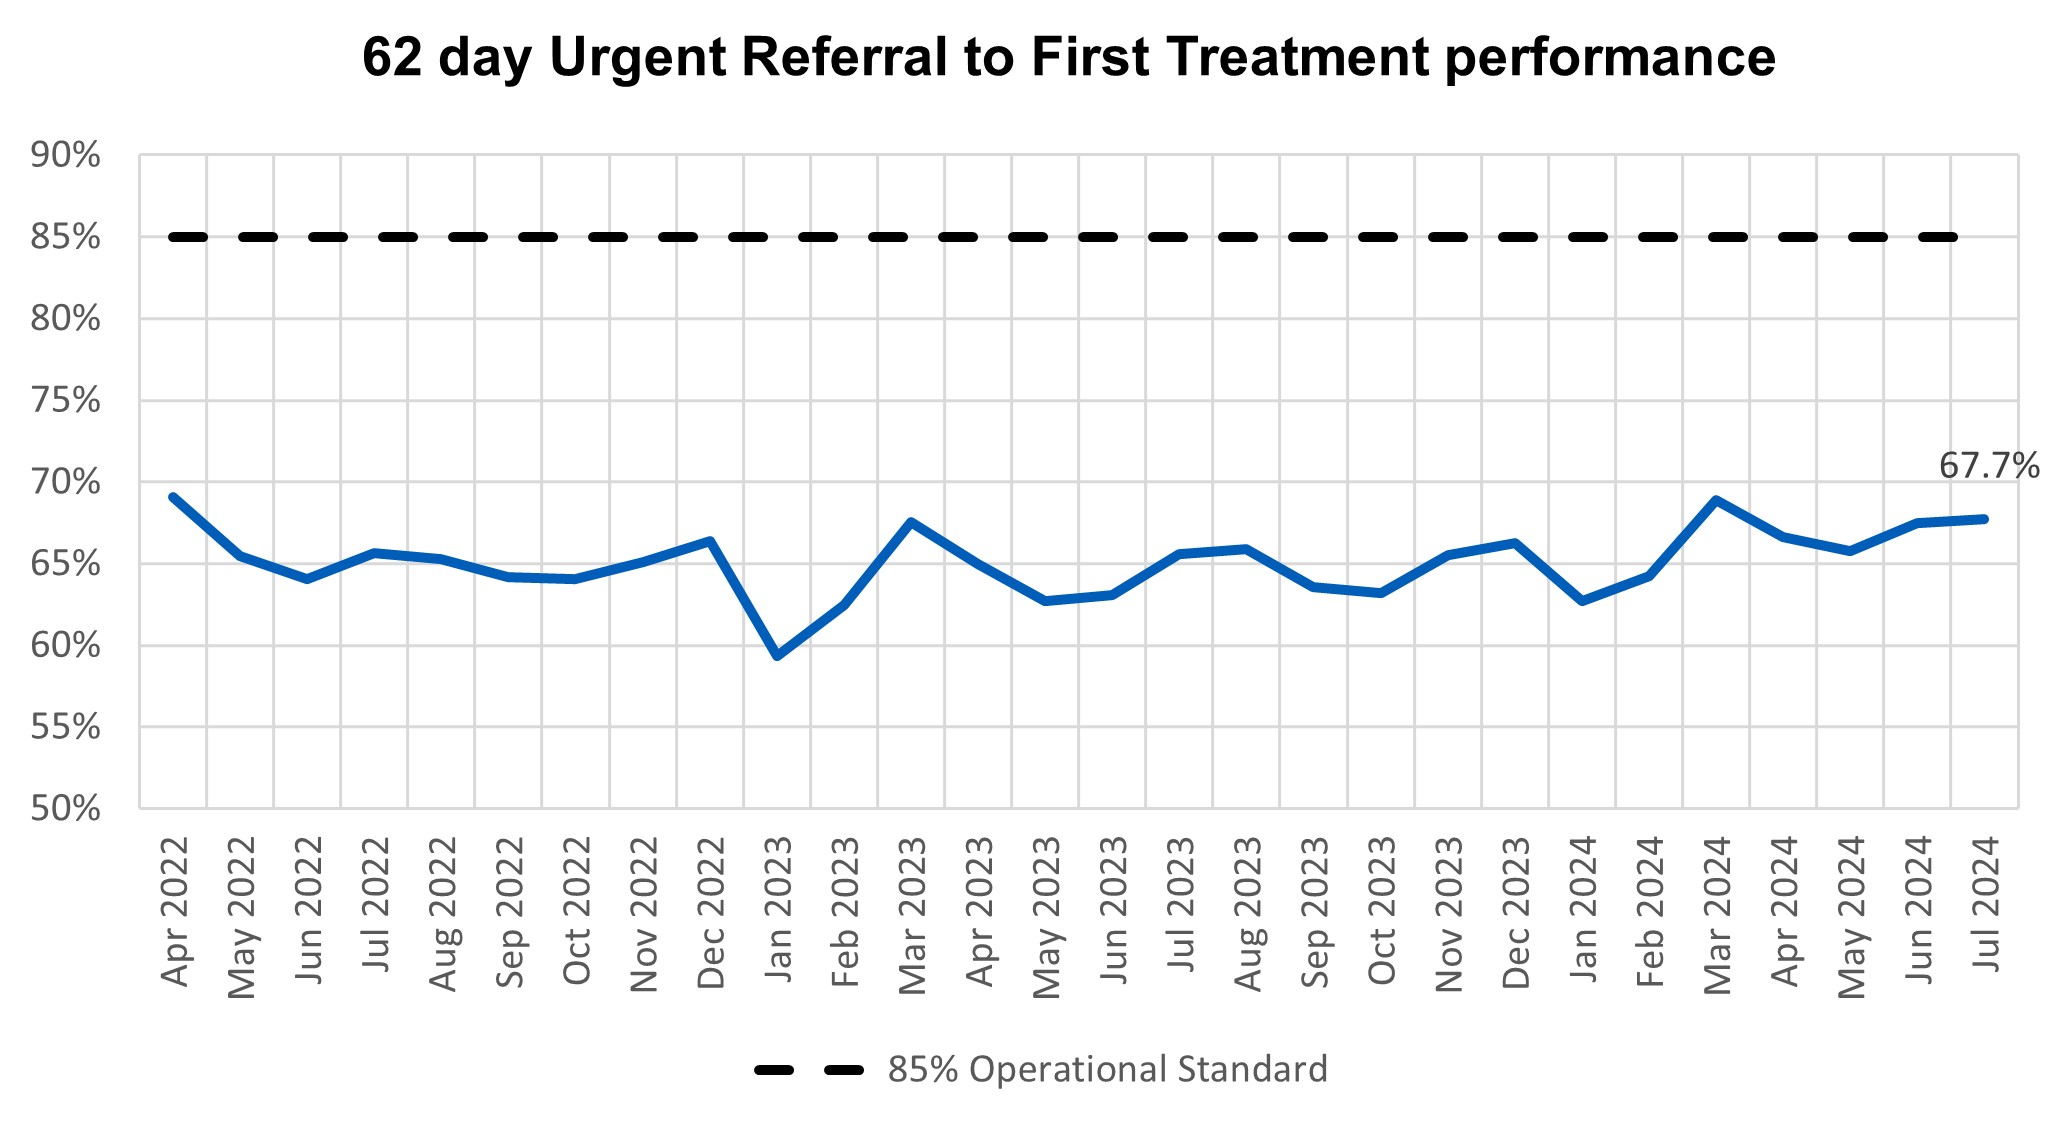
In July, performance against the 62 day Urgent Referral to First Treatment Standard, was 67.7% which was 2.1% higher than at the same point last year, but still well below where we want to see it. The NHS has set the ambition to improve this to 70% to March 2025, as a first step in recovering performance to the 85% standard.
62 day urgent referral to first treatment performance
Mental Health
The Mental Health Service Data Set (MHSDS) performance data shows that 59,632 people were reported to have accessed a Specialist Community Perinatal Mental Health (PMH) Service or a Maternal Mental Health Service (MMHS) in the 12 months from August 2023 to July 2024. This is an increase of 641 from last month’s figure, and access remains more than one year behind trajectory to achieve access of 66,000, as set out in the NHS Long Term Plan. COVID-19 had an impact, but the bigger issue is underinvestment in some PMH services compared to LTP expectations across 2020/21 to 2023/24, impacting workforce and service expansion. Average monthly growth has been slower since April 2024 compared to Q4 2023/24.
In July 2024, 341 Children and Young People (CYP) counted in MHSDS as starting urgent treatment for eating disorders, of which 70.7% started within 1 week. This is an increase when compared to 67.1% reported for in the rolling 3 months to June 2024. 2,337 counted in MHSDS as starting non-urgent treatment, of which 74.2% started within 4 weeks. This is an increase when compared to 70.0% reported in the rolling 3 months to June 2024.
The referral to treatment CYP Eating Disorder Standard ambition stated that by March 2020/21 95% of CYP in need start NICE concordant treatment for an eating disorder within 1 week if urgent, and 4 weeks if routine/non-urgent. In collaboration with stakeholders, we are refreshing CYPED commissioning and technical guidance. This work is ongoing, and we anticipate that this will conclude in winter 2024/25. In addition, following the switch of data source for eating disorders from the Strategic Data Collection Service to MHSDS in April 2023, we continue to work with analysts, systems and service providers to improve the quality of submissions to the data set, primarily in relation to the recording of correct SNOMED codes for NICE concordant interventions.