
Organisation objective
- Statutory item
Executive summary
2023/24 was a challenging year for the NHS, with industrial action, ongoing significant demand and a continued recovery journey. Against these challenges, it made notable progress and achieved some meaningful ambitions and commitments by the end of March 2024 as outlined below. However, a significant number of deliverables remain outstanding with further work is required and plans are laid in place for 2024/25 to build on these achievements.
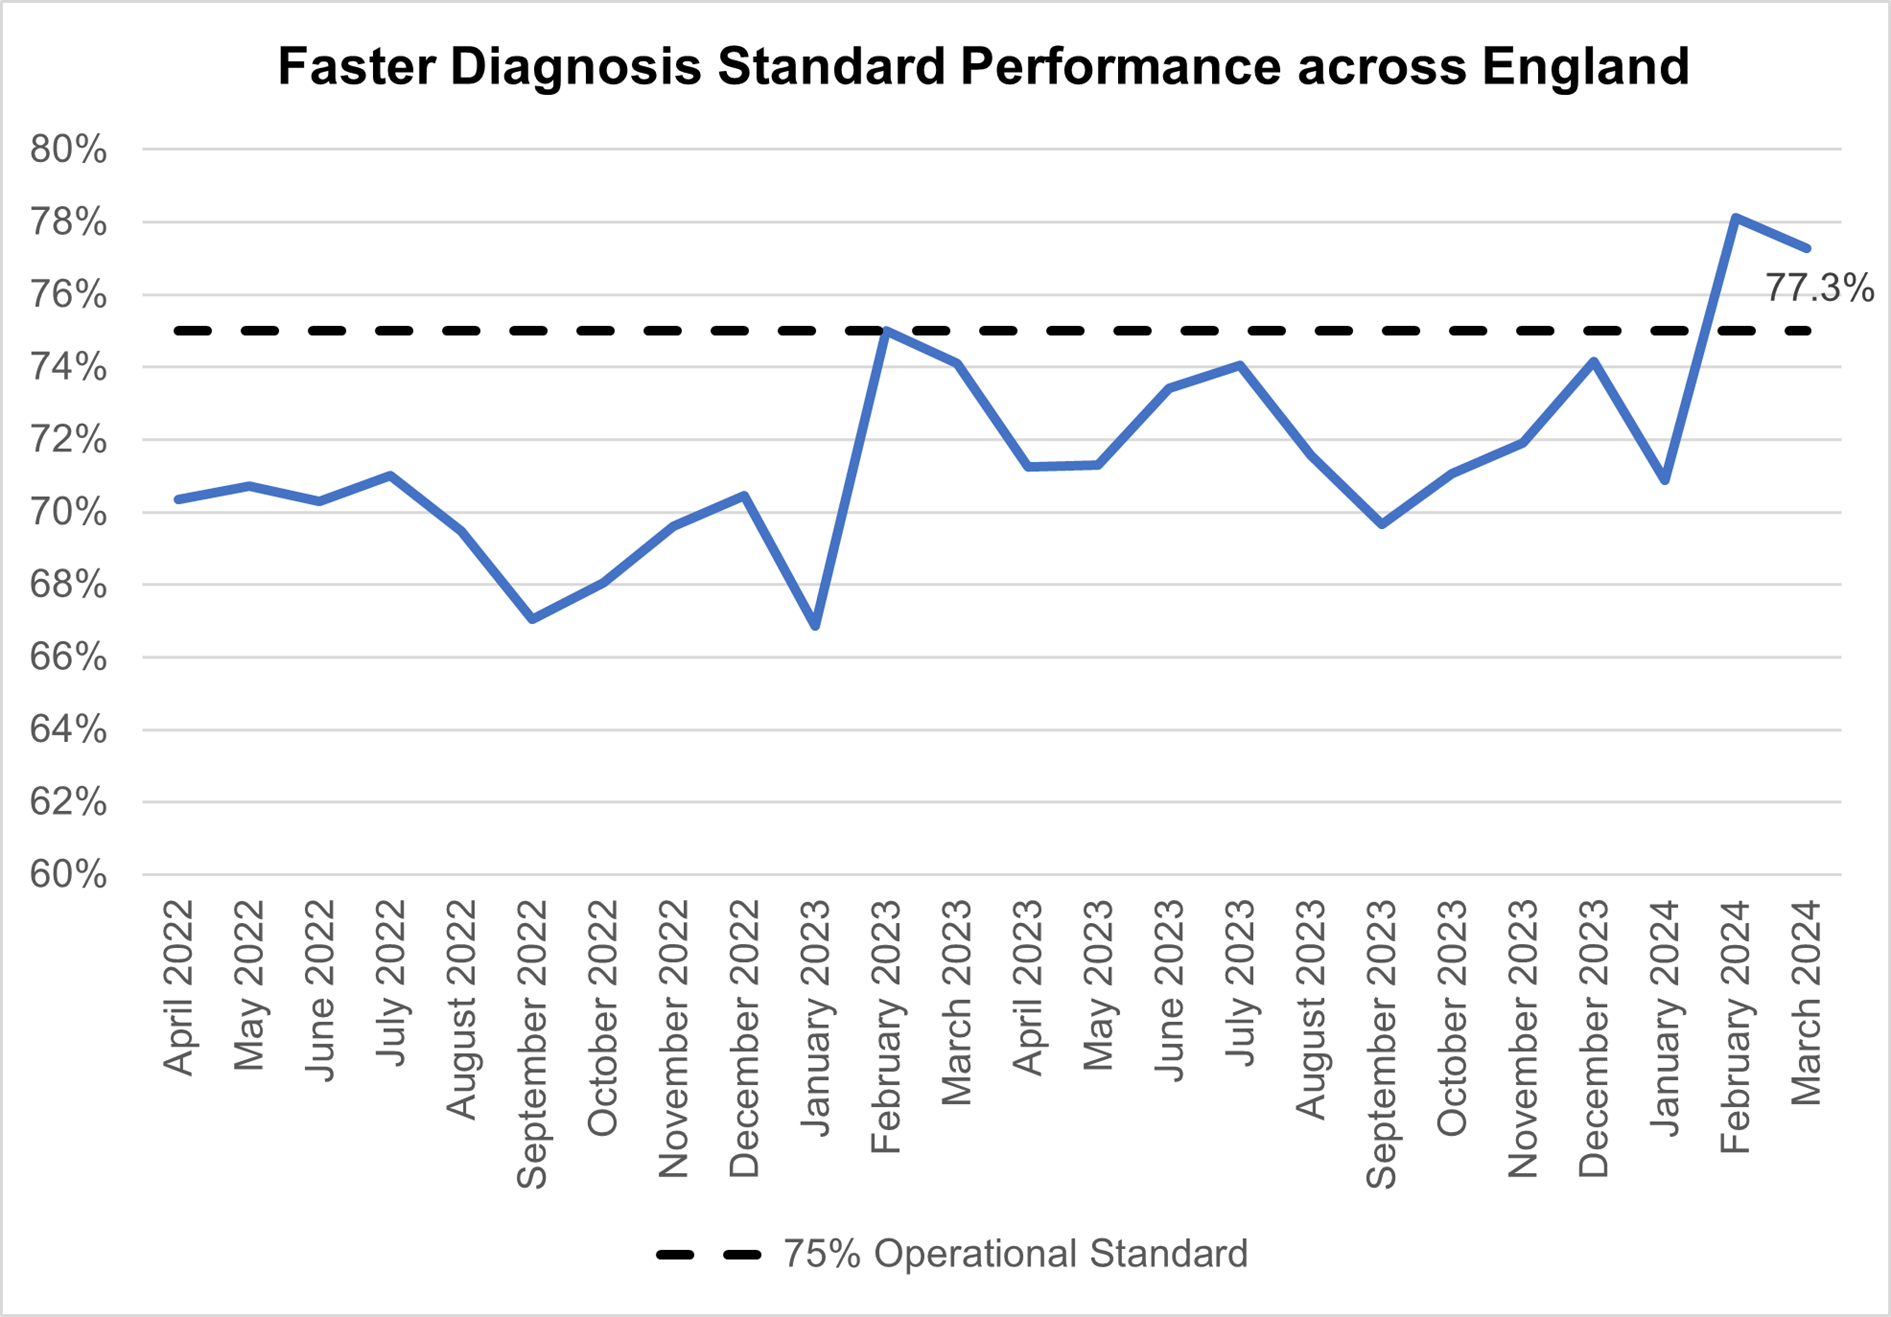
The NHS has met the 28-day faster diagnosis target for cancer for the second month in a row. Almost 200,000 (77%) people referred or screened received a definitive diagnosis or the all clear within 4 weeks, exceeding the national ambition of 75%.
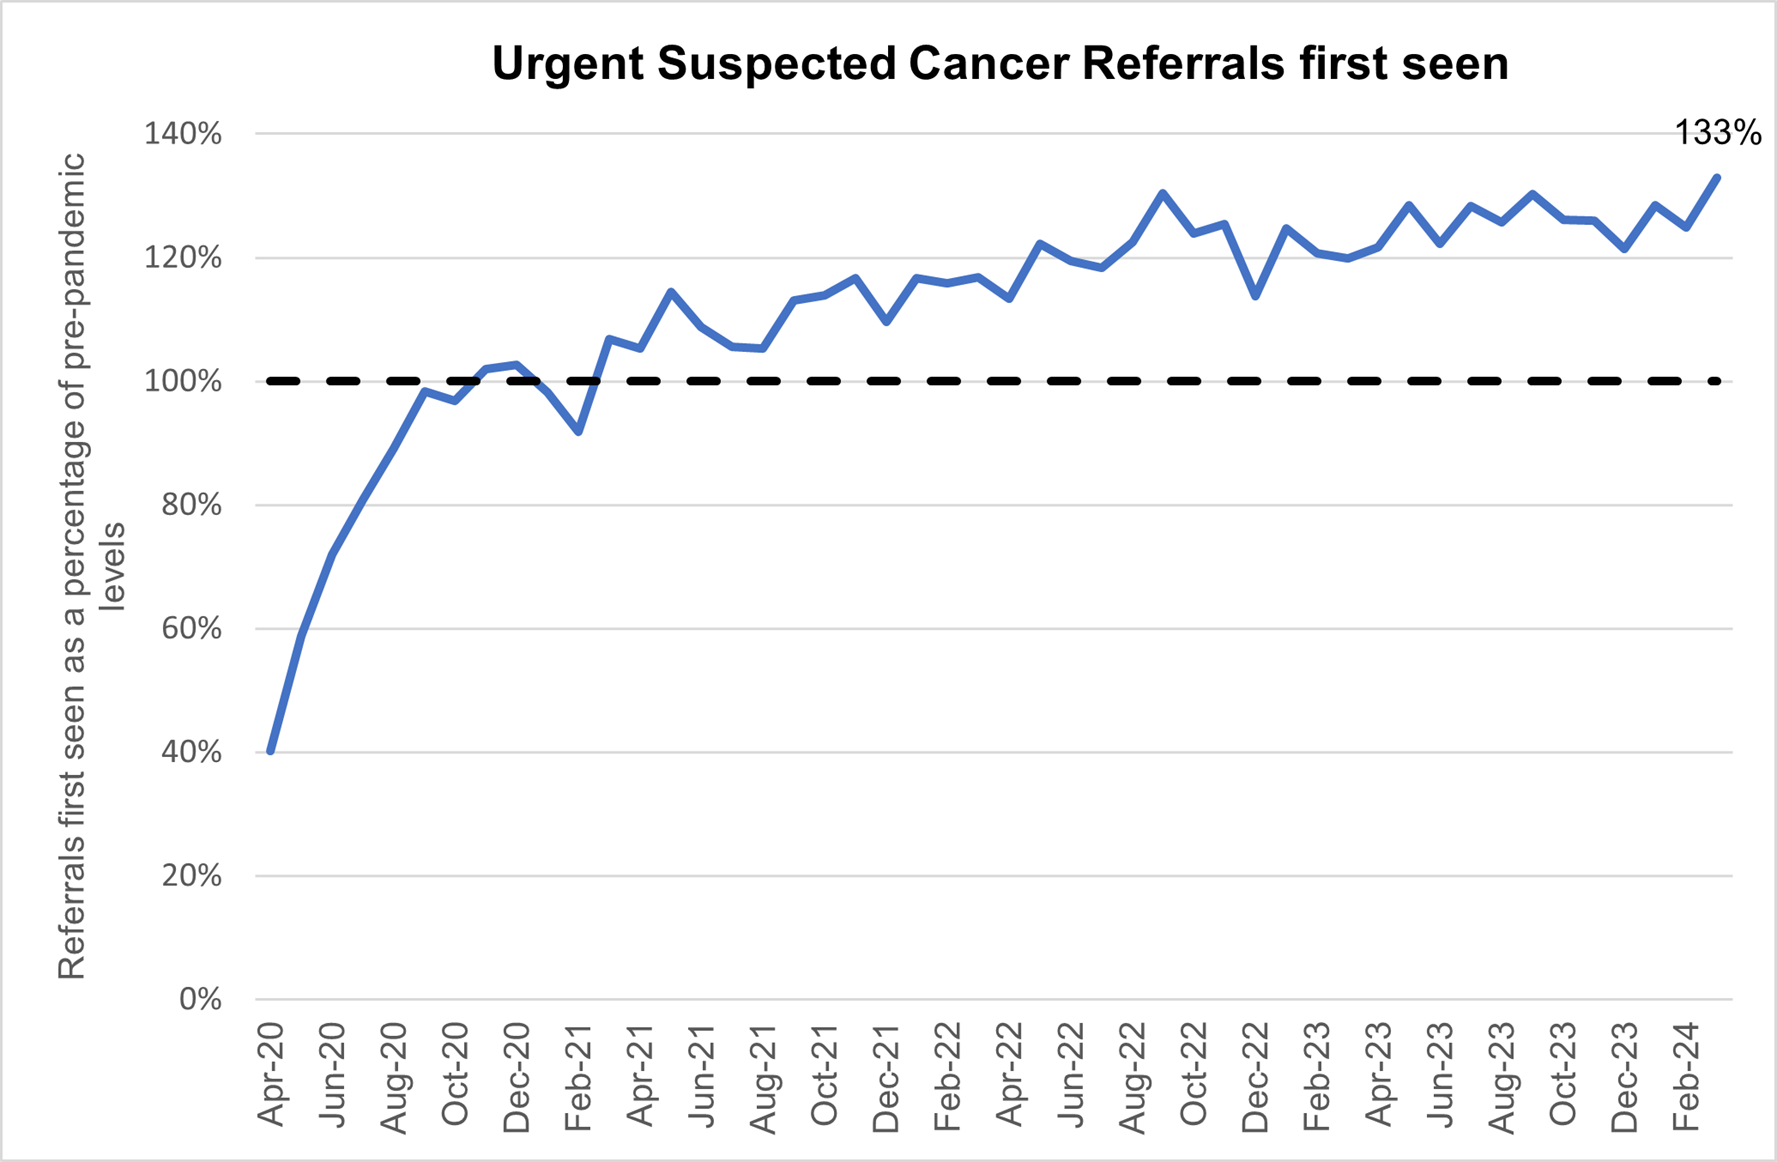
March saw the NHS deliver the highest number of urgent cancer appointments on record with more than 12,500 patients seen every day – more than a quarter of a million over the month (254,594). This is 33% more referrals than the NHS was seeing before the pandemic – the equivalent of 3,000 more patients per working day.
Urgent and emergency (UEC) care services faced higher demand than usual in April. Despite this, the NHS managed to sustain improvements across the 2 main ambitions from the UEC delivery plan. There were 2,230,414 attendances in A&Es across England (9.9% higher than April 2023). 74.4% of patients attending A&E were admitted, transferred or discharged within 4 hours.
Ambulance services answered 732,239 calls to 999, or 24,408 per day. This is an increase of 3% compared to April 2023. The average ambulance response time for a category 2 call was 30 minutes and 22 seconds. This is 3 minutes and 28 seconds faster than in March.
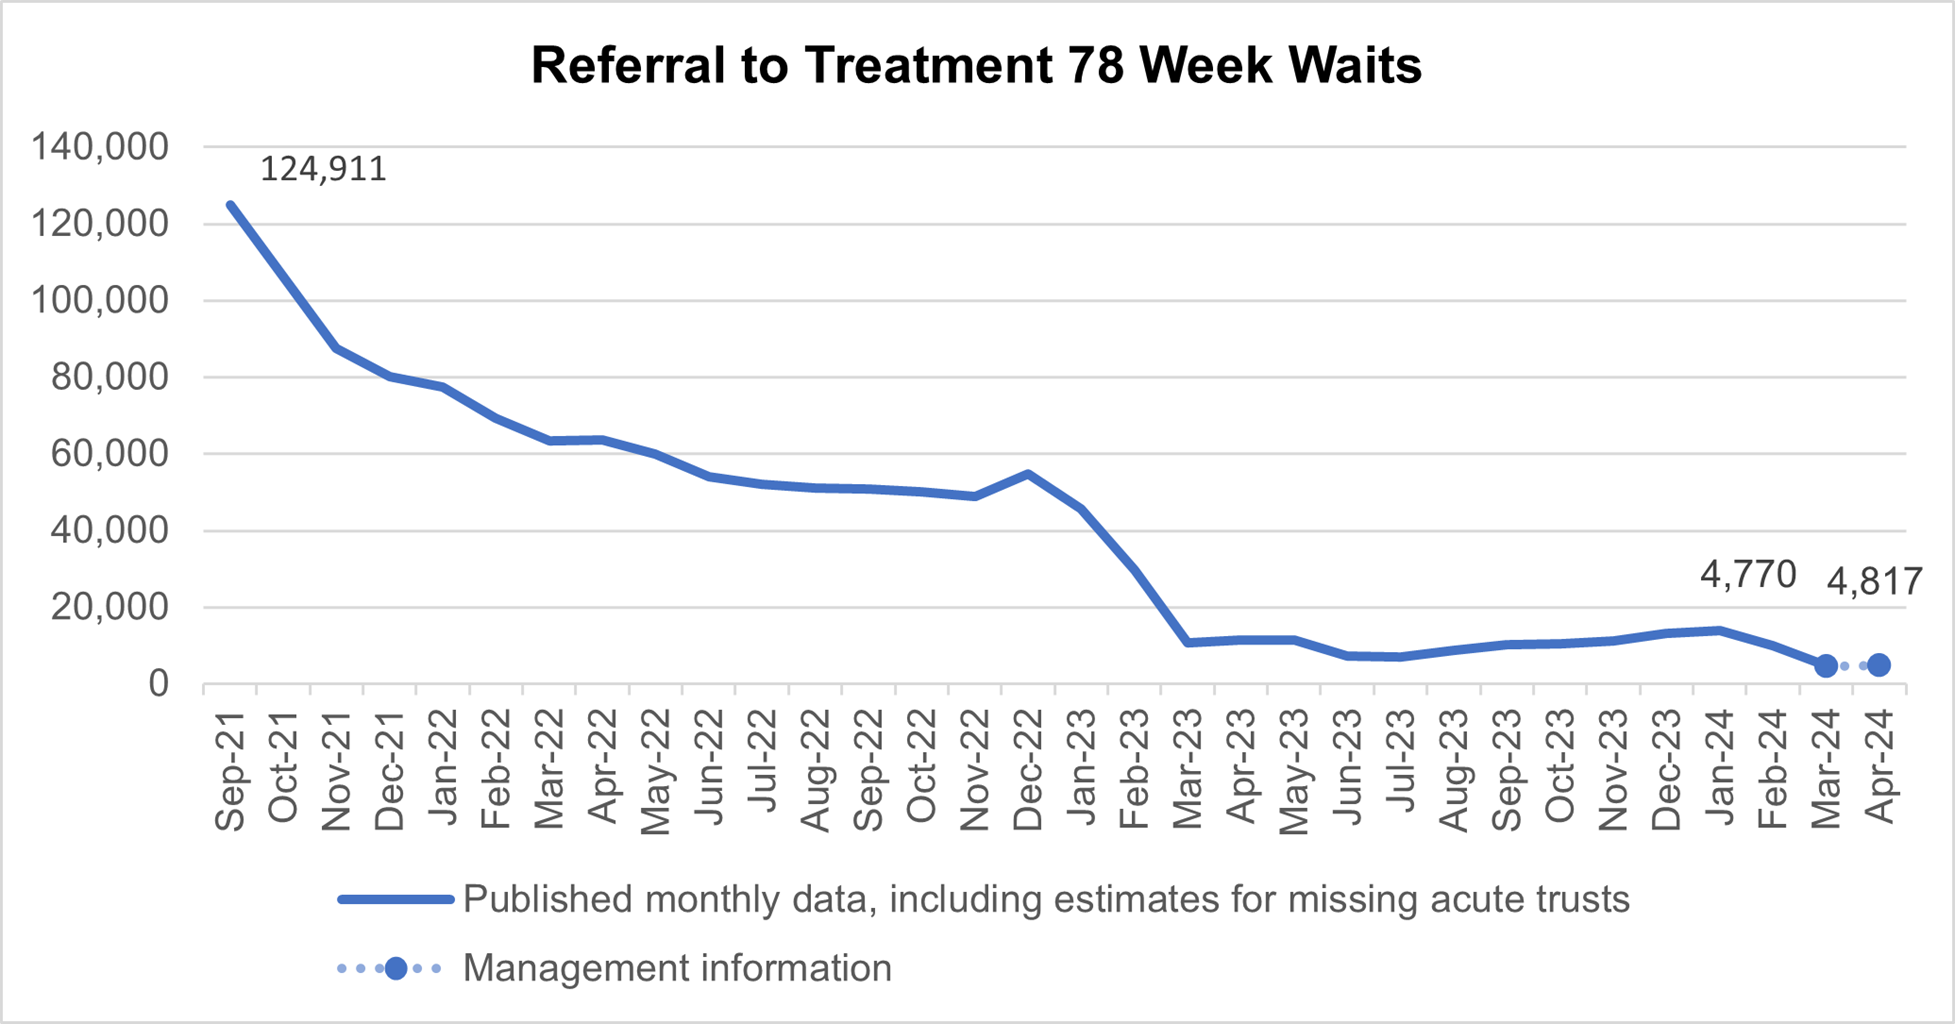
The number of patients waiting more than 65 weeks for treatment was 48,968 at the end of March, down 47% from 92,213 in January and down by 92% from a peak of 124,911 in September 2021. 4,770 patients were waiting more than 78 weeks for treatment at the end of March, down by 52% from 9,969 in February and down 96% from a peak of 124,911 in September 2021.
The national dementia diagnosis rate for March 2024 was 64.8%, higher than in March 2023 and March 2022, and demonstrates steady improvement since January 2023. This is the highest national diagnosis rate since March 2020
Urgent and emergency care
1. Urgent and emergency (UEC) care services faced higher demand than usual in April. Respiratory illnesses caused by winter viruses at the start of the month brought additional pressures. The service also dealt with an early Easter bank holiday – a time when the whole system typically experiences increased pressure.
2. Despite this, the NHS managed to sustain improvements across the two main ambitions from the UEC delivery plan.
3, There were 2,230,414 attendances in A&Es across England. This is 9.9% higher than April 2023.
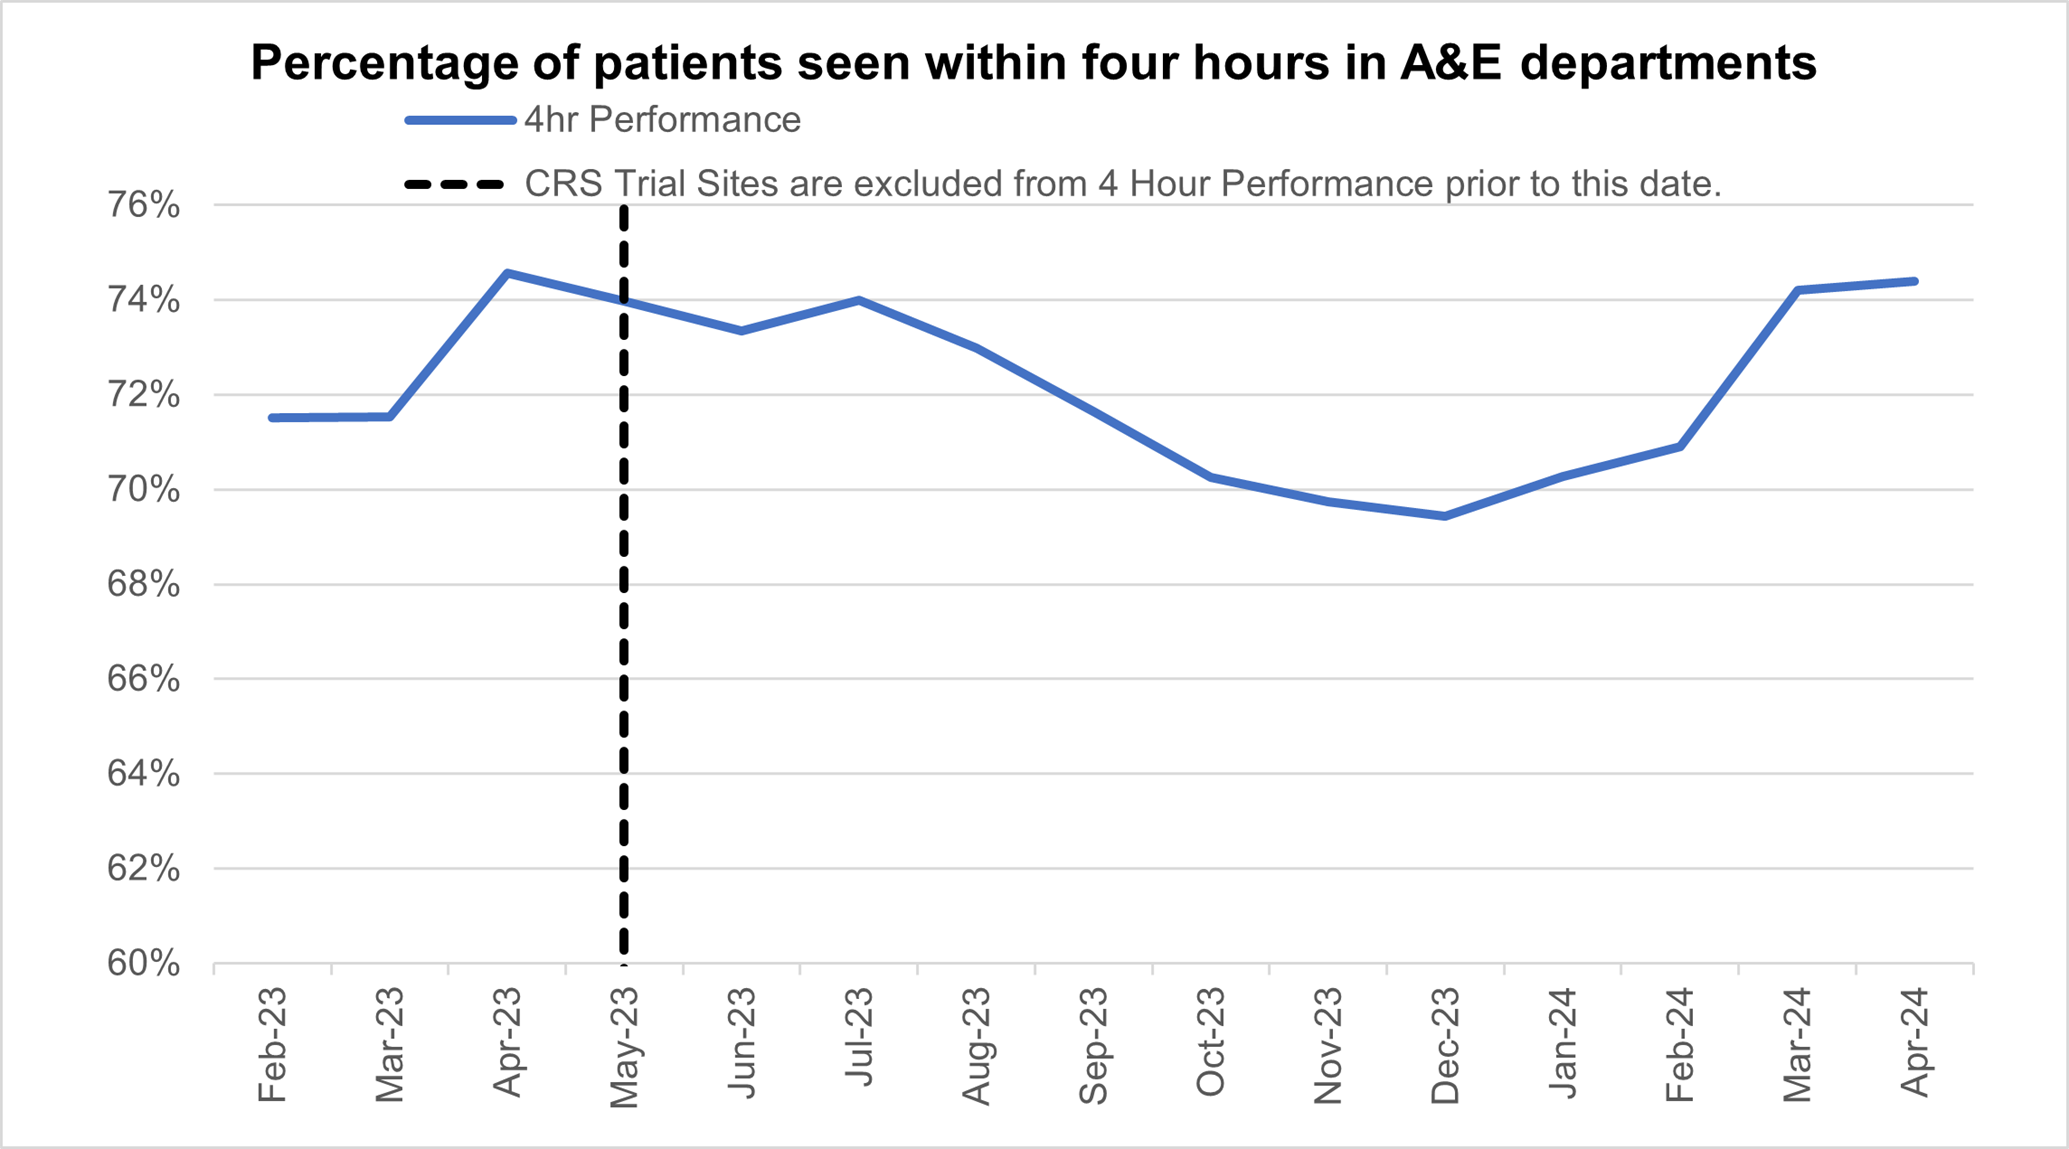
4. 74.4% of patients attending A&E were admitted, transferred or discharged within four hours. This compares to 74.2% in March 2024.
Graph showing percentage of patients seen within four hours in A&E departments
5. Ambulance services answered 732,239 calls to 999, or 24,408 per day, an increase of 3% compared to April 2023. There were 367,031 incidents where a patient was conveyed to A&E, 3% more than in April 2023.
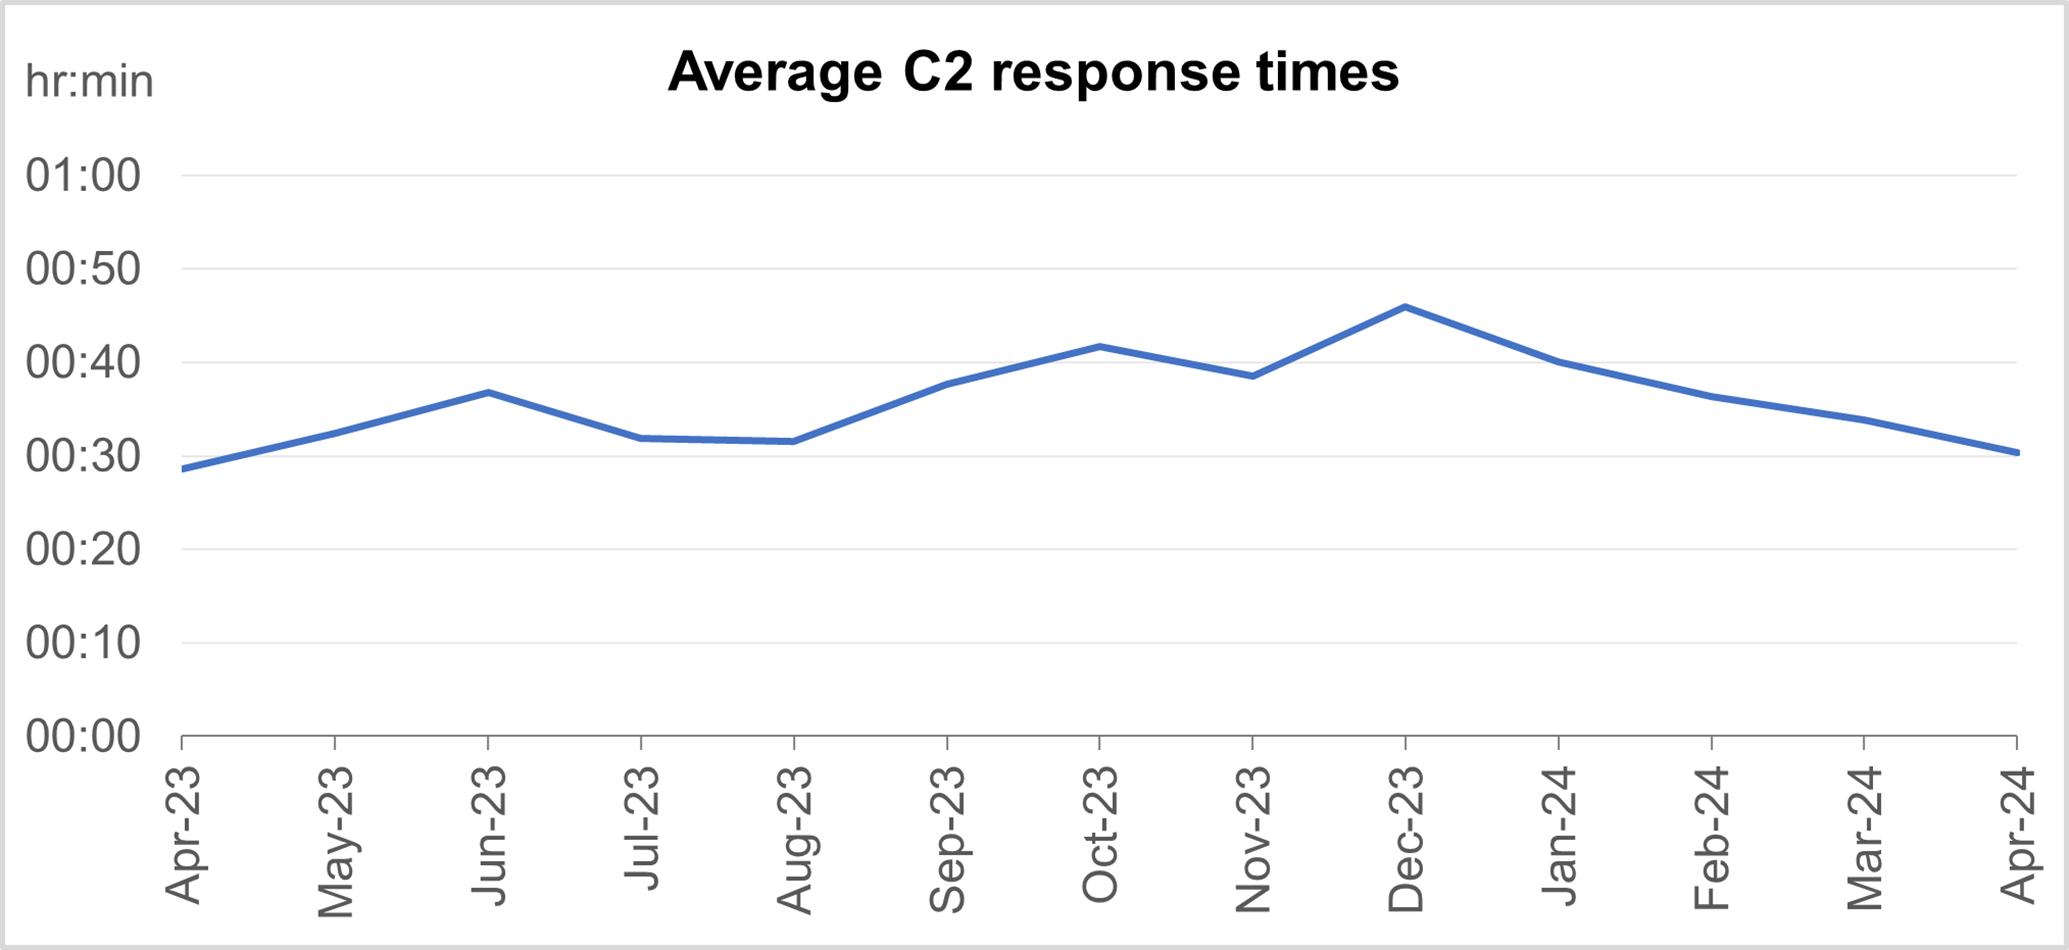
6. The average ambulance response time for a category 2 call was 30 minutes and 22 seconds. This is 3 minutes and 28 seconds faster compared to March and is the first time in a year that the average was below 31 minutes.
Graph showing average category 2 response times
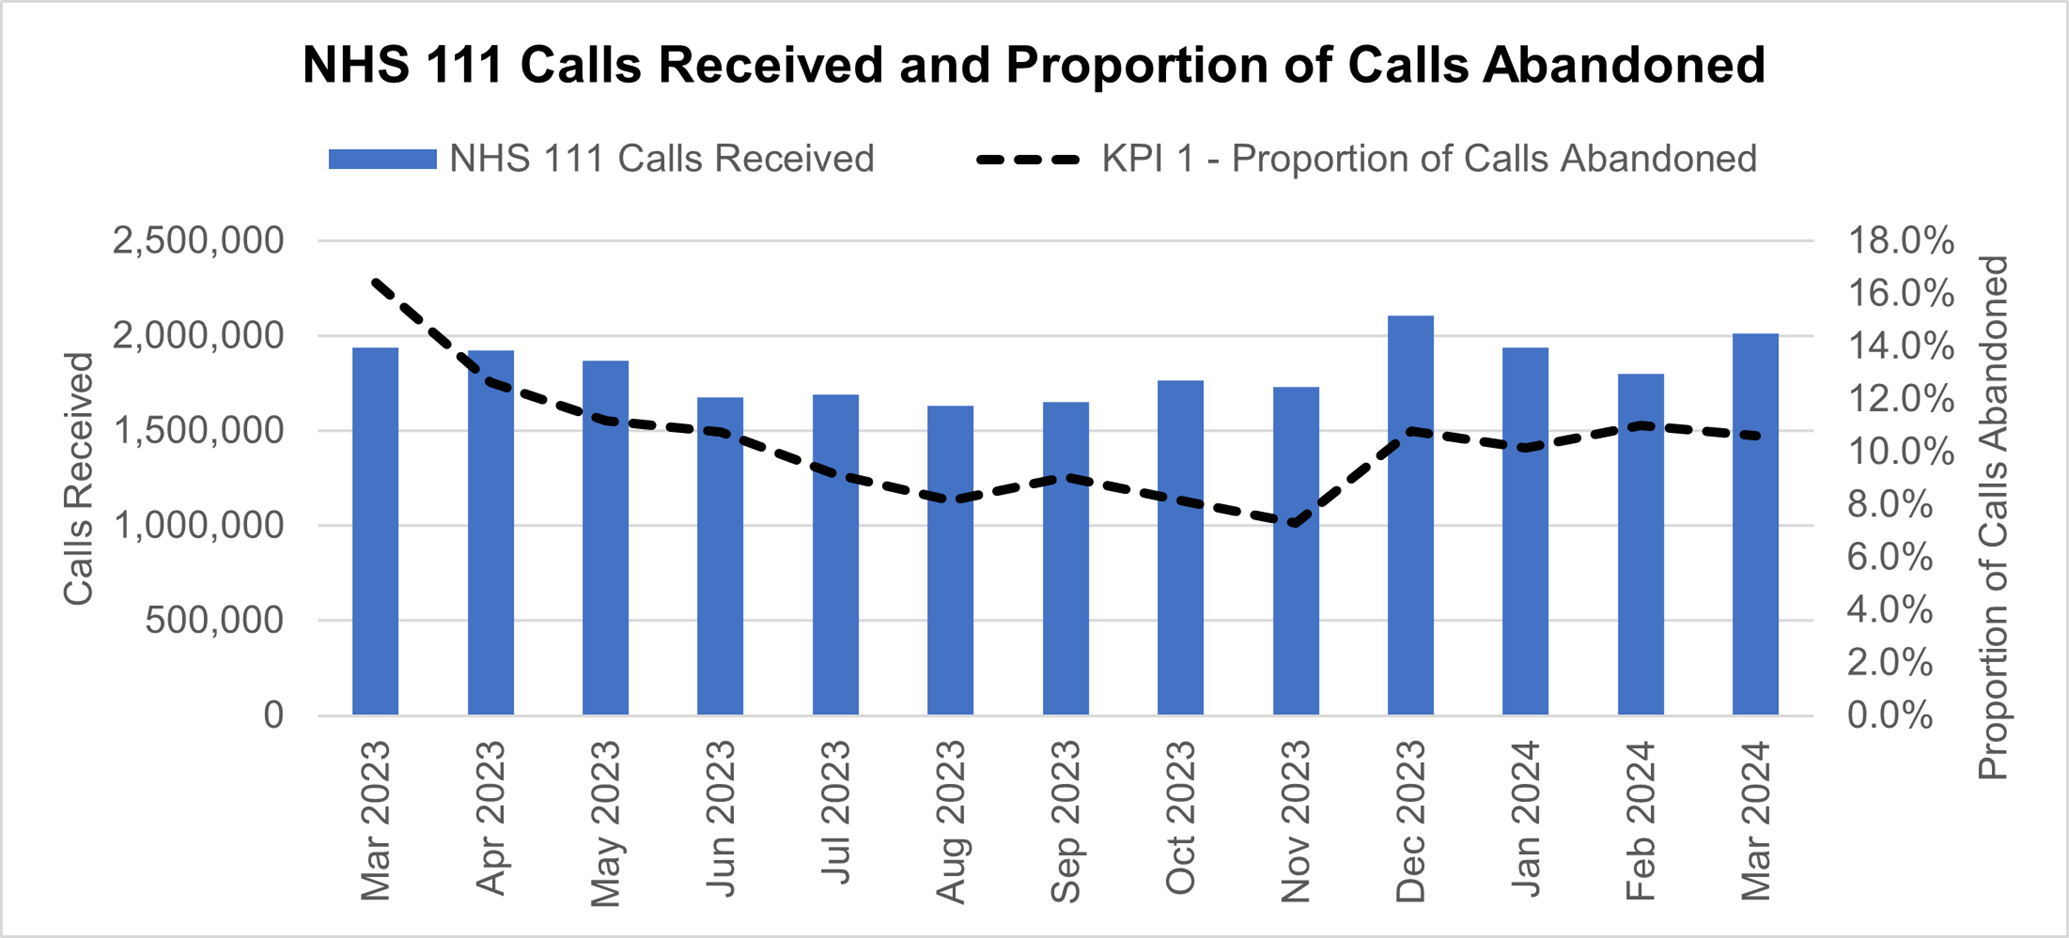
7. NHS 111 received 2,011,994 calls (around 64.9 thousand per day) in March. Demand was 3.7% up year on year and 11.9% above volumes received in February 2024.
8. While demand was high, performance improved with the proportion of calls abandoned dropping 0.4 percentage points from the previous month (now at 10.6%) and the average speed to answer reducing by 8 seconds to 197. Improvement is linked to NHS 111 providers’ efforts to cover Easter demand and the National Resilience Service handling 4.3% of calls answered to help reduce pressure on the service.
Graph showing NHS 111 calls received and proportion of calls abandoned
Elective recovery
9. Long waits reduced in March despite disruption from seasonal demand and an early Easter bank holiday.
10. As of the end of March there were 7.54 million waits for procedures and appointments and an estimated 6.29 million people waiting for care – the same as at the end of February.
11.This month’s statistics are reflective of the recent changes to the reporting requirements of community services pathways [1] meaning all community services (eg community paediatrics and community medicine) should now be recorded within community datasets rather than the referral to treatment data.
12. Management information indicated the impact on the overall waiting list of the change would be a decrease of approximately 43,000 pathways. Analysis indicates about 36,000 of these pathways were excluded from February’s figures and most of the remaining 7,000 pathways were excluded from March’s figures.
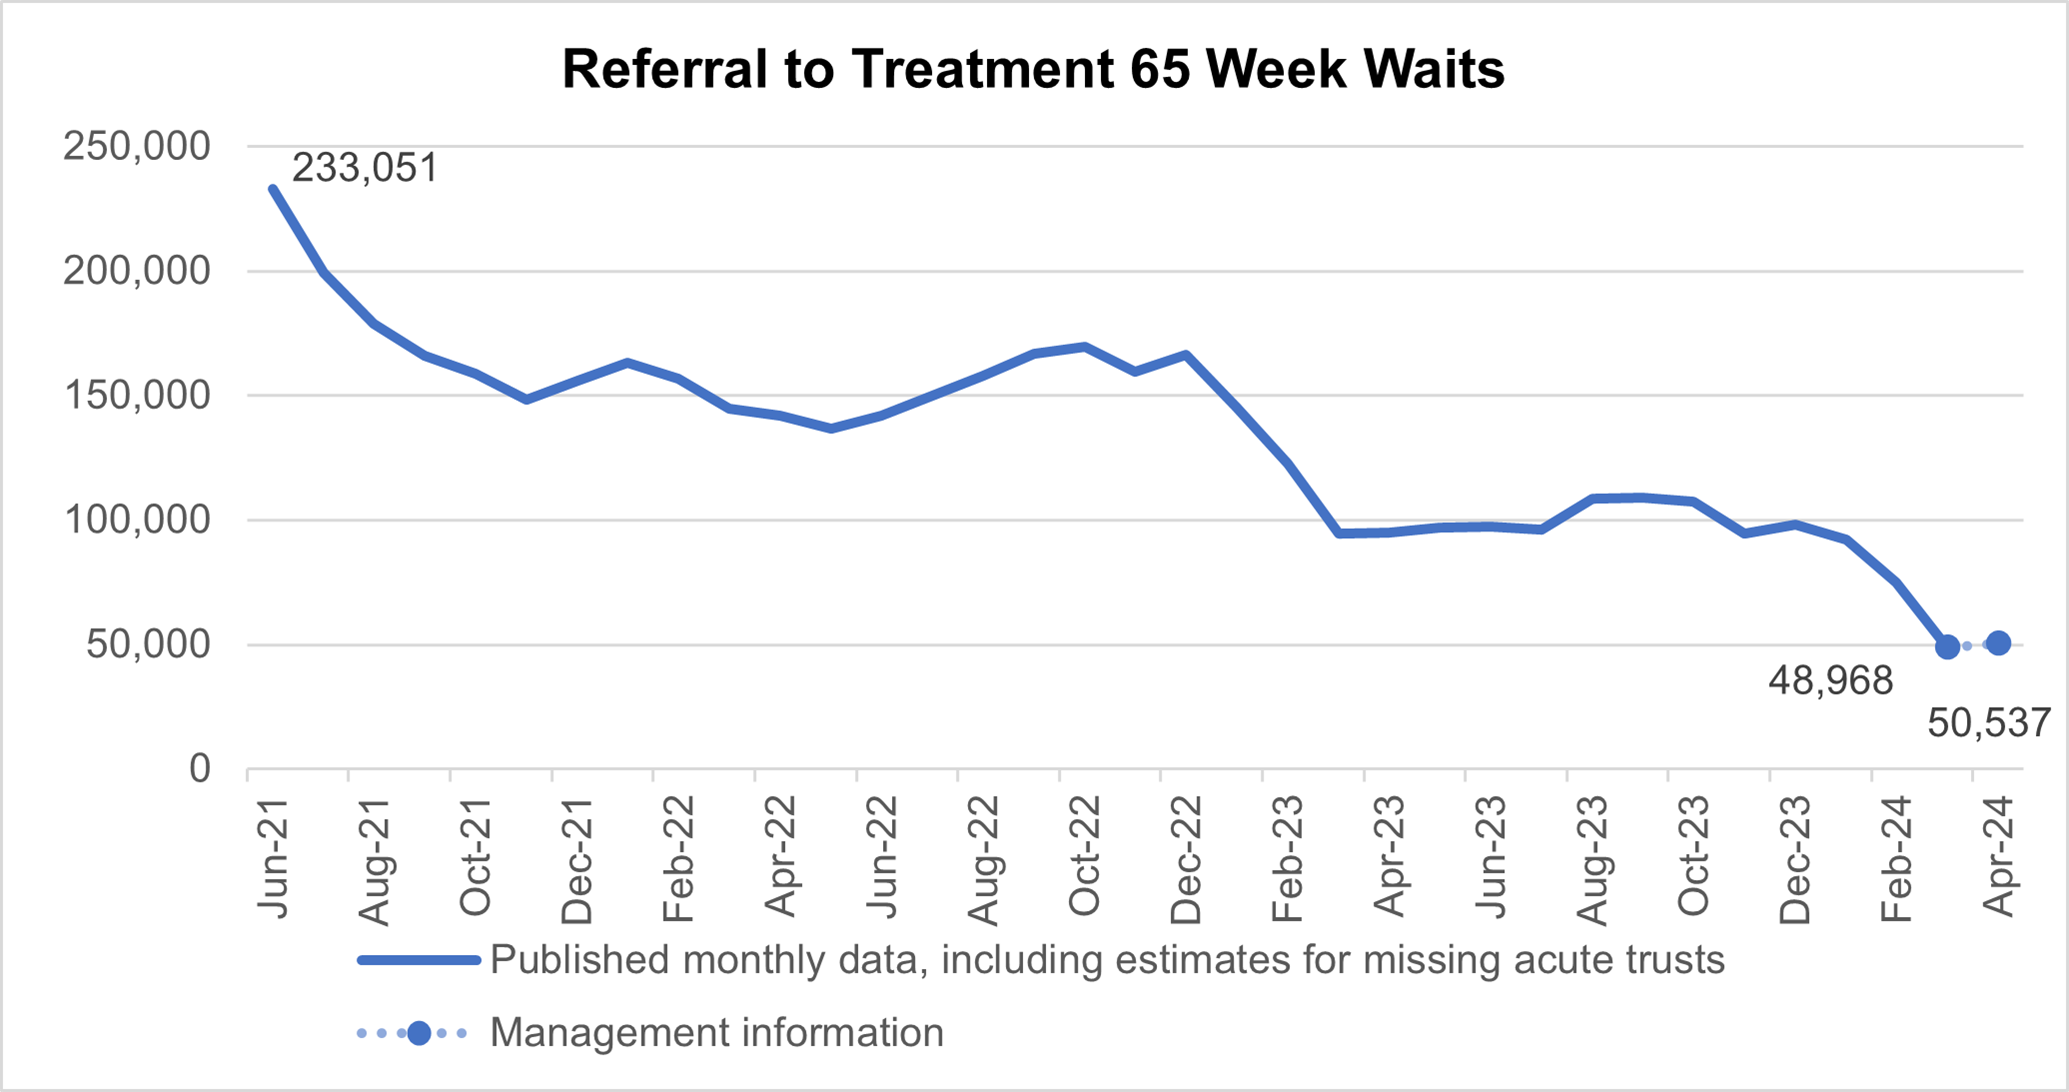
13. The number of patients waiting more than 65 weeks for treatment was 48,968 at the end of March, down from 75,004 (35%) in February and from 92,213 (47%) in January. Additional management data [2] suggests this number slightly increased between March and April, with 50,537 patients waiting more than 65 weeks for treatment as of the end of April.
[1] From February 24, community services pathways (eg community paediatrics and community medicine) should now be recorded within community datasets rather than the referral to treatment data.
[2] Management information for the latest month is taken from the Waiting List Minimum Dataset which is subject to less validation than the published monthly figures and does not include estimates for missing providers.
Graph showing referral to treatment 65 week waits
14. 4,770 patients were waiting more than 78 weeks for treatment at the end of March, down from 9,969 in February (52%). This is down 96% from a peak of 124,911 in September 2021. Additional management data suggests this number largely held between March and April, with 4,817 patients waiting more than 78 weeks for treatment as of the end of April.
Graph showing referral to treatment 78 week waits
Cancer
15. Levels of urgent suspected cancer referrals hit a new record in March 2024, with the 12,554 patients seen per working day a new record high, exceeding the previous record of 12,376 patients seen per working day in July 2023. This is 33% more referrals than the NHS was seeing before the pandemic – the equivalent of 3,000 more patients per working day.
16. To meet this high demand, treatment activity was also at its highest ever level with over 1,400 patients starting cancer treatment per working day.
17. In the context of these record activity levels, there has been a reduction in the 62- day cancer backlog and improvements in all cancer waiting times standards compared to the same month last year.
Graph showing urgent suspected cancer referrals first seen
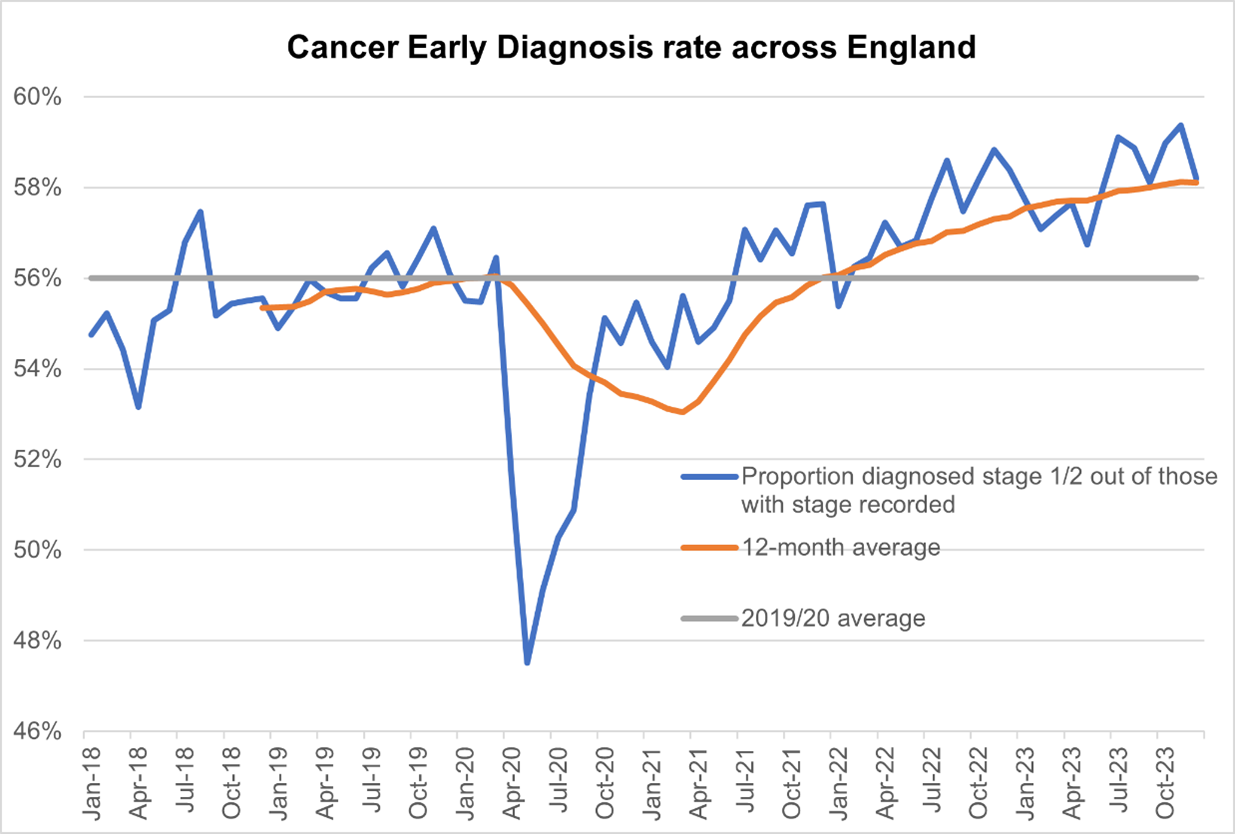
18. Almost 340,000 people received their first treatment for cancer over the last year between April 2023 and March 2024 – the highest year on record, and up by around 27,000 on the same period pre-pandemic. GPs have been referring people for urgent cancer checks in record numbers since March 2021. Since then, NHS staff have seen over a million more people than in the same period prior to the pandemic.
19. The increase in referrals has contributed to the NHS diagnosing more cancer at an early stage than ever before. We are diagnosing a higher proportion of cancers at an early stage now than ever before – about 2 percentage points higher than before the pandemic. Survival is also at an all-time high. In 2023, the Annals of Oncology published findings showing that cancer deaths are around 10% lower in the UK compared to just 5 years ago.
Graph showing cancer early diagnosis rate across England
20. The NHS is working hard to keep up with this increase in demand. It has been accelerating the installation of new diagnostic capacity, much of it in community diagnostic centres.
21. Performance against the Faster Diagnosis Standard in March was 77.3%, the second month in a row that the 75% standard was met (the NHS met the standard for first time ever in February). Given the progress made against this standard, the NHS is now planning to raise this standard to 80% in 2 years.
Graph showing faster diagnosis standard performance across England
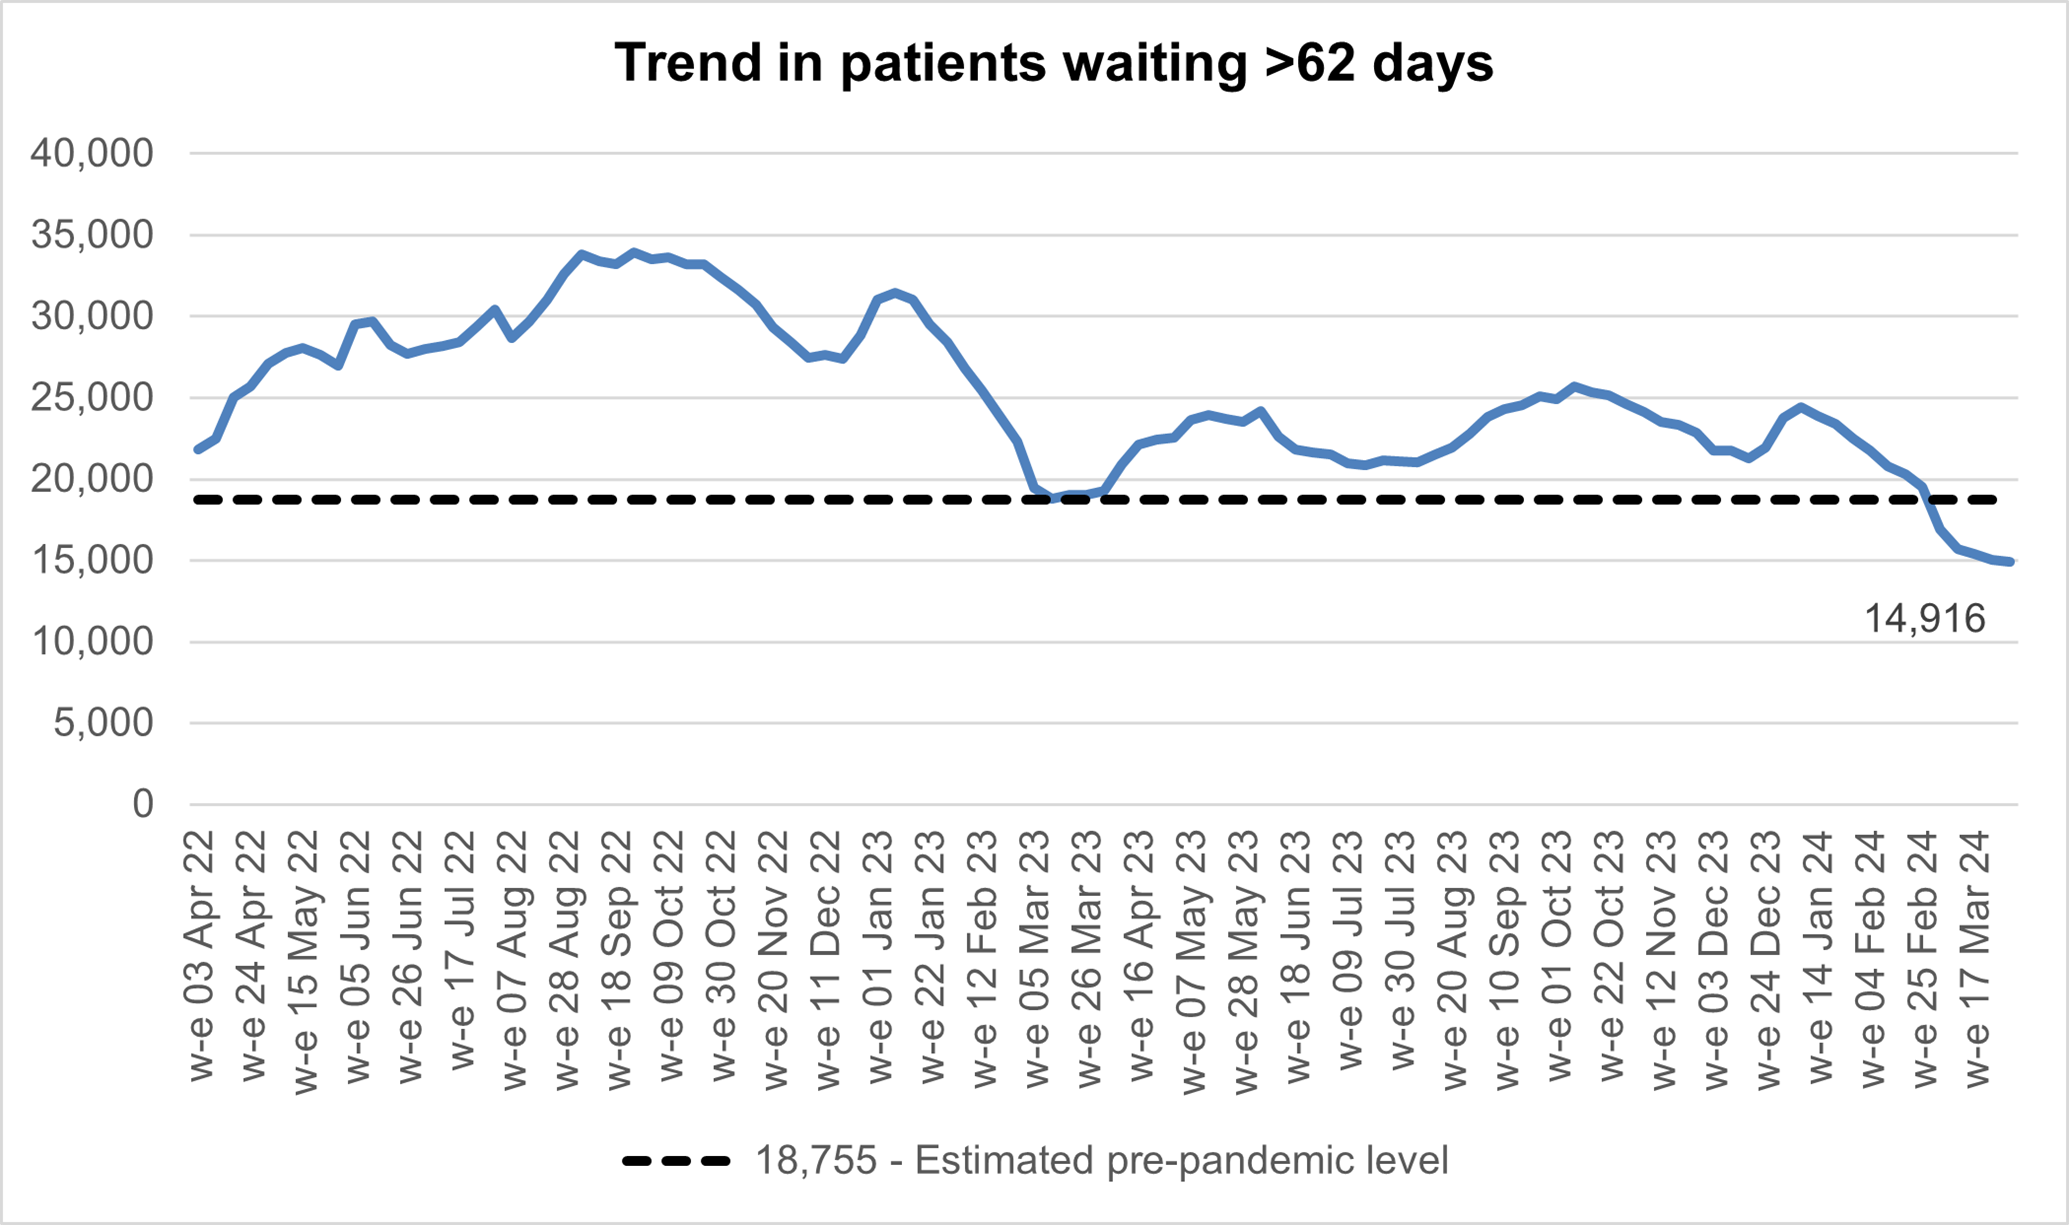
22. The NHS also succeeded in meeting the target to reduce the backlog to pre-pandemic levels, with the backlog reducing to 14,916 at the end of March, nearly 4,000 patients lower than the national ambition of 18,755 patients, and nearly 20,000 patients less than the peak seen in September 2022.
Graph showing trend in patients waiting >62 days
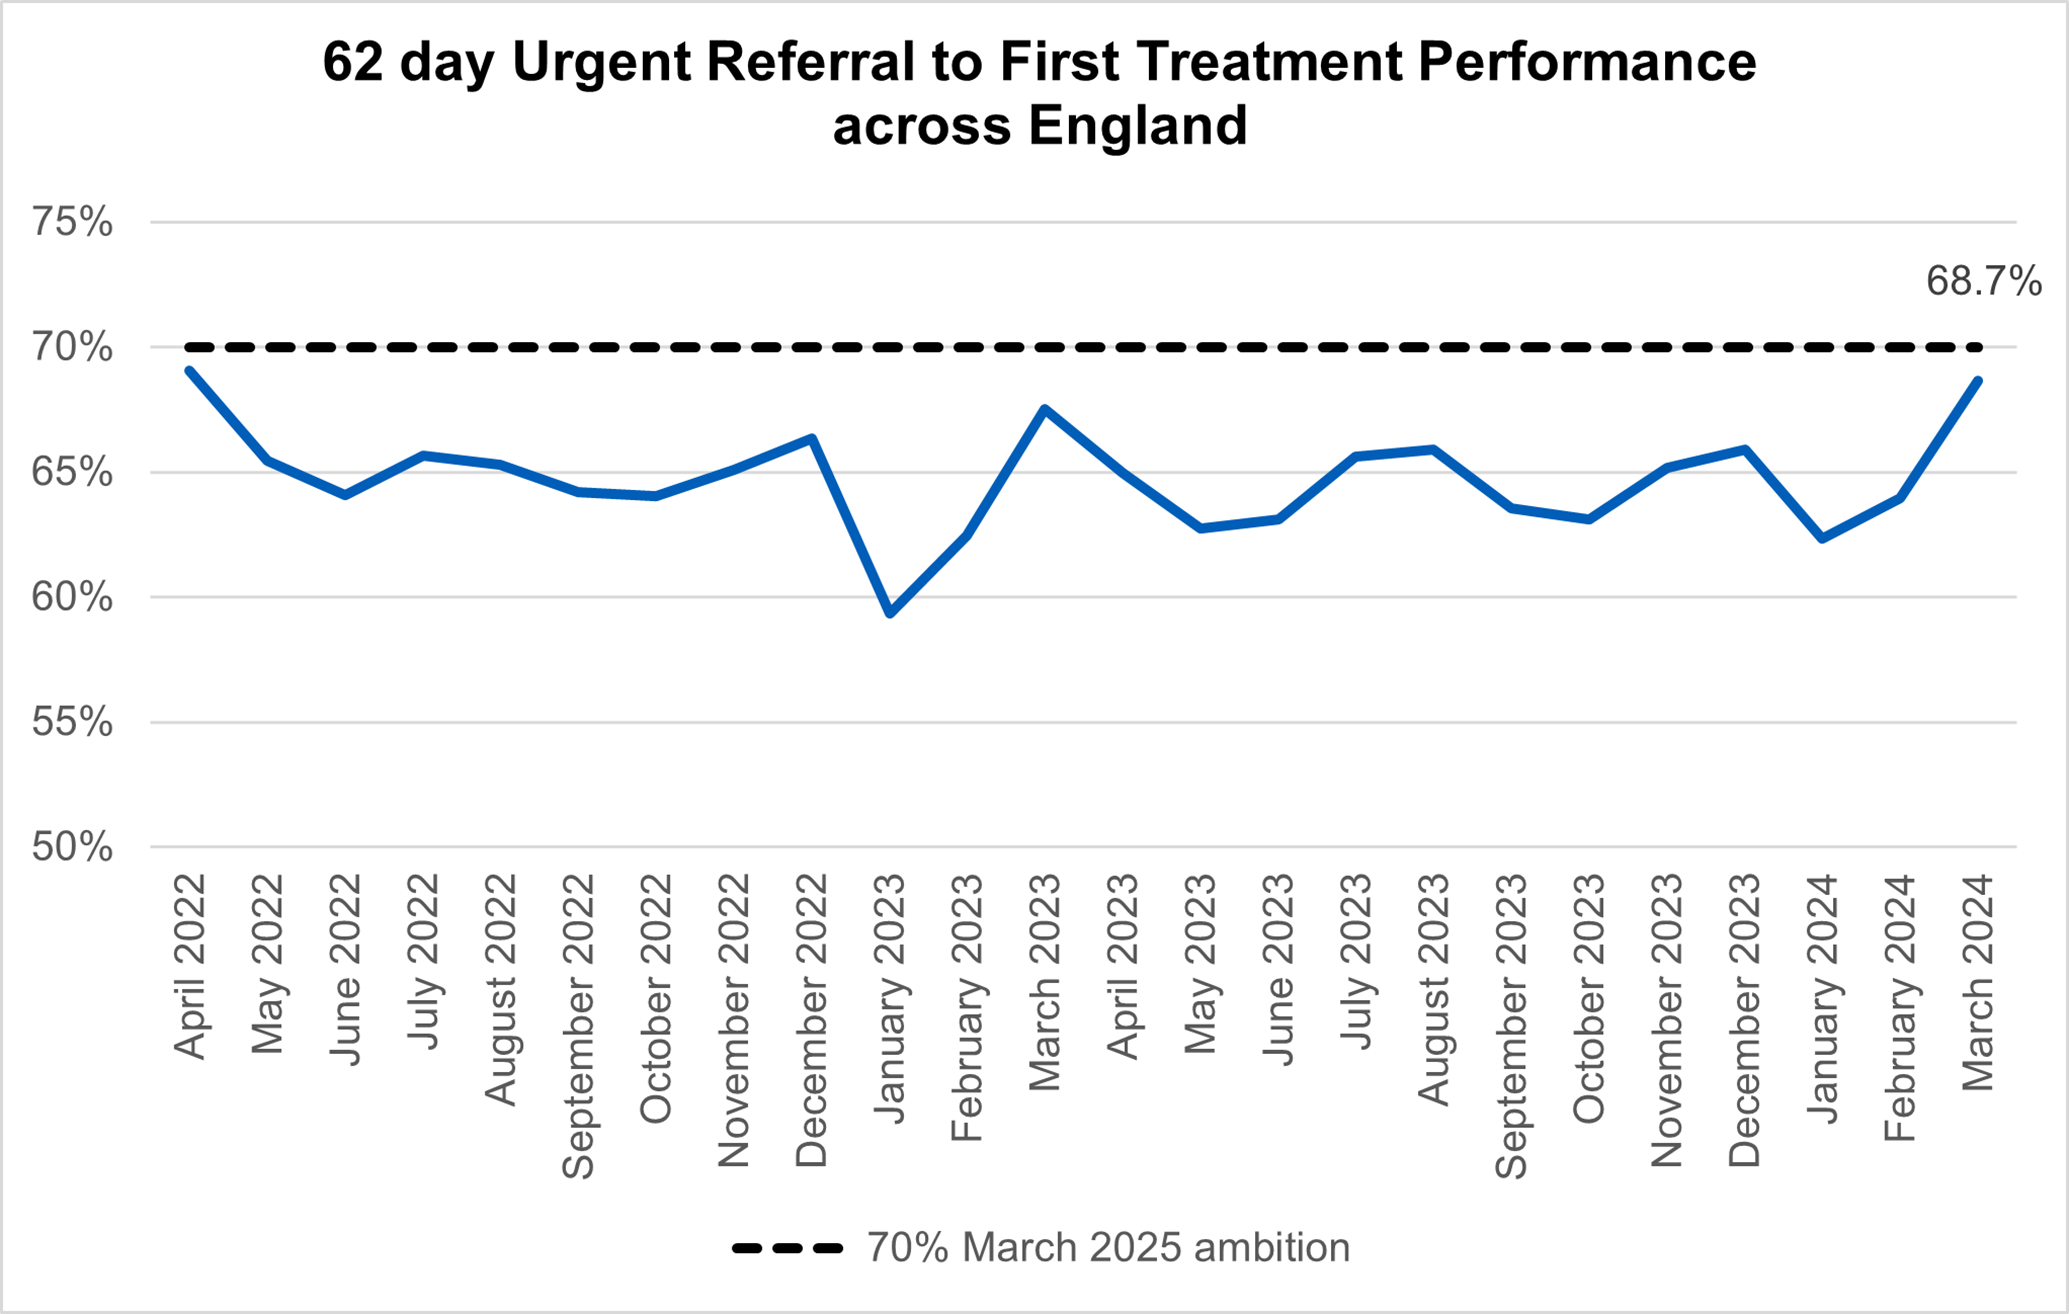
23. The NHS can now shift focus to the 62-day combined Urgent Referral to First Treatment 62 day Standard. In March, performance against this increased to 68.7%, which was 1.2% higher than at the same point last year. The NHS has set the ambition to improve this to 70% to March 2025, a first step in recovering performance to the 85% standard.
Graph showing 62 day urgent referral to first treatment performance across England
Mental health
24. More people than ever before are now in contact with NHS services for support for their mental health, with almost five million patients in contact with services in 2022/23, an increase of more than one million compared to 2016/17. This includes 1.1 million children and young people, 1.3 million adults in contact with core community mental health services, 1.2 million adults in contact with NHS talking therapies services, and 85,000 people in contact with specialist perinatal mental health services.
25. The recovery rate, which tracks the proportion of NHS talking therapies patients that were at caseness [1] at the start of treatment and below caseness at the end, remains above the national standard of 50% (50.9% March 24).
[1] Recovery is measured in terms of ‘caseness’ – a term which means a referred patient has symptoms of depression or anxiety that exceed a defined threshold, as measured by data set outcome measures. A patient is considered recovered if their scores on the depression and/or the relevant anxiety/medically unexplained symptoms measure are above the clinical cut-off on either measure at the start of treatment, and their scores on both measures are below the clinical cut-off at the end of treatment. NHS talking therapies operates a policy of only claiming demonstrated recovery. This means that the small number of patients who have missing post-treatment data are coded as having not recovered.
26. Access for March 2024 is 98,268, accounting for 62% of the access target of 158,333, although progress towards the target trajectory varies significantly across the country with 82% being achieved in the East of England.
27. A national NHS talking therapies campaign took place from 15 January 2024 to 8 March 2024, as part of the Help Us Help You series.
28. The aim of this campaign was to:
- increase awareness of NHS talking therapies, and the conditions they treat
- increase appropriate referrals to the services
- maximise the impact of the rebrand (ie there is now one consistent name for services across England)
- focus on specific under-represented groups
29. This is the final monthly publication of data towards the Long Term Plan ambition of achieving the access target of 1,862,851, with 68% of the access target achieved (1,257,718) for 2023/24. The Autumn statement period commences from April 2024 with a move in focus to courses of treatment (2+ appts) over the next 5 years.
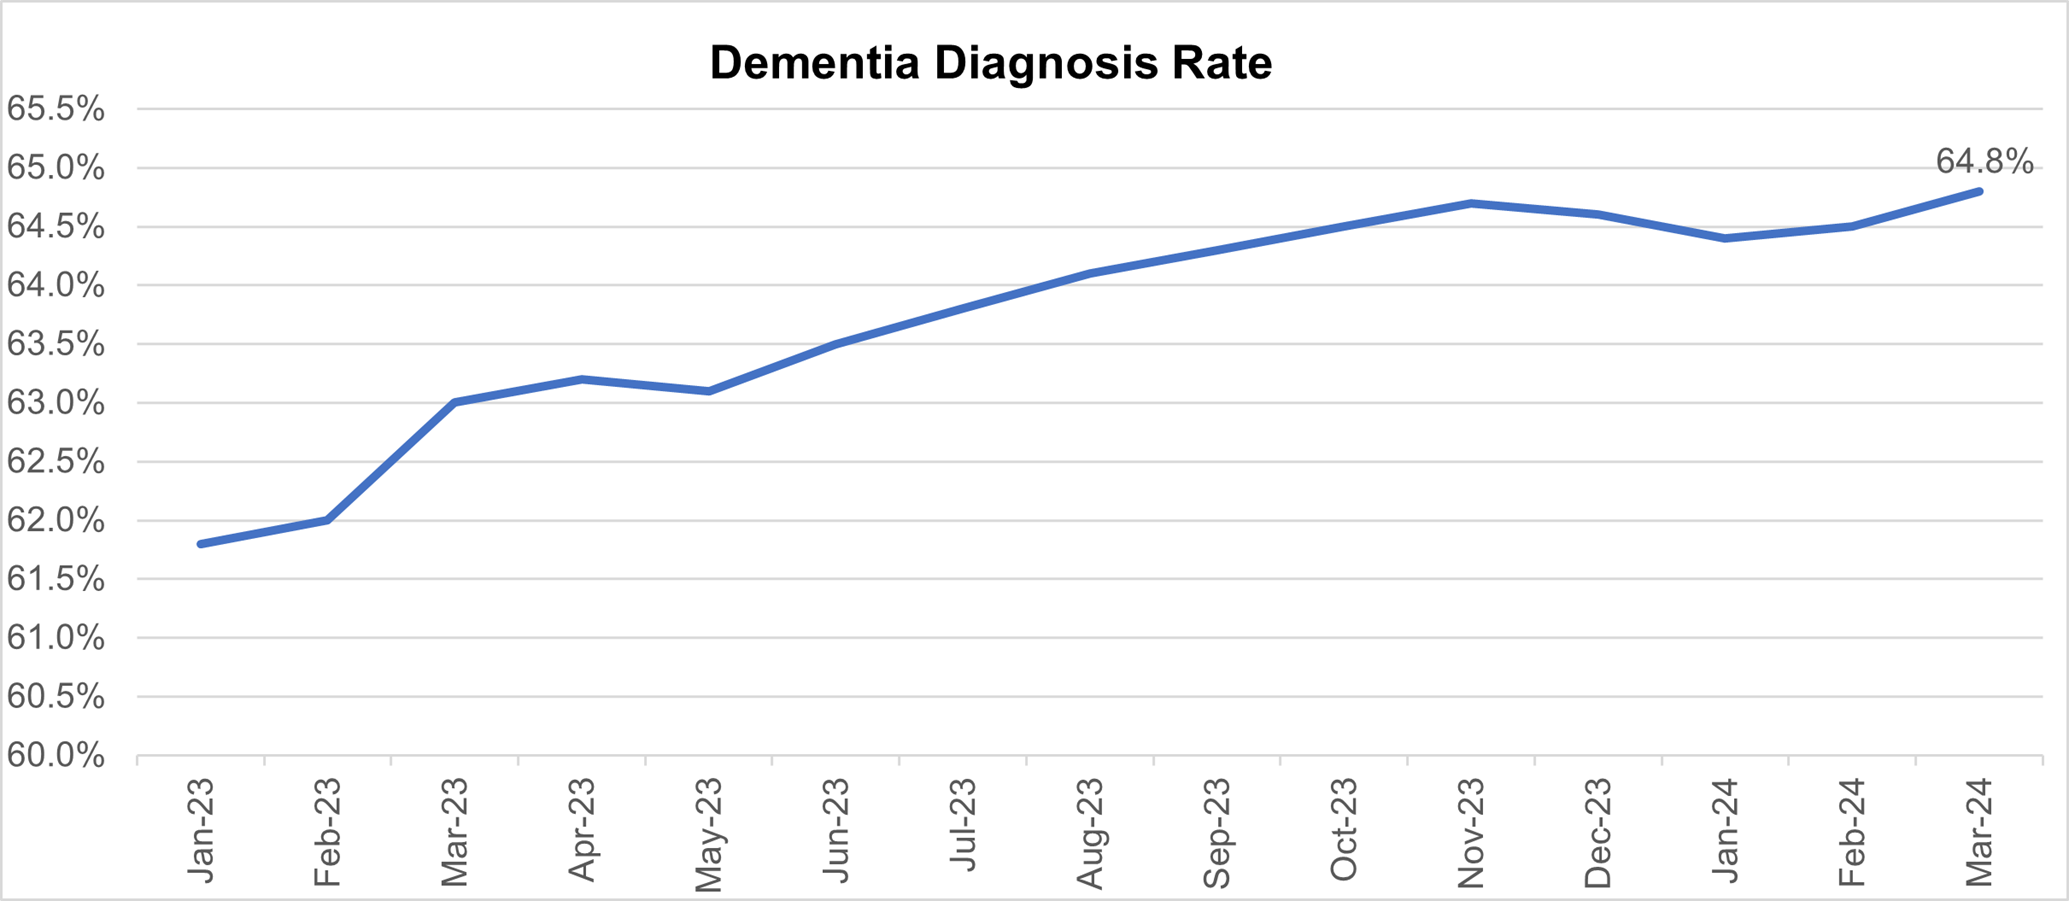
30. NHS England’s priorities and operational planning guidance sets out a key ambition to improve quality of life, effectiveness of treatment, and care for people with dementia by increasing the dementia diagnosis rate to 66.7% by March 2025.
31. A key route for dementia diagnosis is through memory services for the majority of people. Between April 2023 to March 2024, there have been 39,209 new referrals to memory services. Comparing previous years for the same period, this is an increase of 11,209 on 2021/22 and 3,029 on 2022/23.
32. The national dementia diagnosis rate for March 2024 is 64.8% (higher than previous years: March 2023 63%, March 2022 62%) and demonstrates steady improvement since January 2023. This is the highest national diagnosis rate since March 2020.
Graph showing dementia diagnosis rate
Publication reference: Public Board paper (BM/24/17(Pu))